Bitcoin Analysis
Bitcoin’s price finished marginally back in green figures again on Tuesday and BTC concluded its daily session +$131.6.
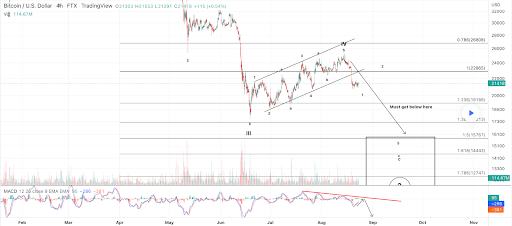
We begin today’s price analyses with the BTC/USD 4HR chart below from maikisch. BTC’s price is trading between the 1.236 fibonacci level [$19,186] and 1 fib level [$22,865], at the time of writing.
The overhead targets on BTC are the 1 fib level and the 0.786 [$26,808].
Conversely, bearish traders are looking to inflict further downside to BTC’s market after regaining possession of the momentum late last week. Those that are short BTC have targets to the downside on the 4HR chart of 1.236, 1.382 [$17,213], 1.5 [$15,767], 1.618 [$14,443], and 1.786 [$12,747].

Bitcoin’s Moving Averages: 5-Day [$22,143.12], 20-Day [$23,199.54], 50-Day [$21,836.43], 100-Day [$28,048.45], 200-Day [$36,530.17], Year to Date [$33,475.65].
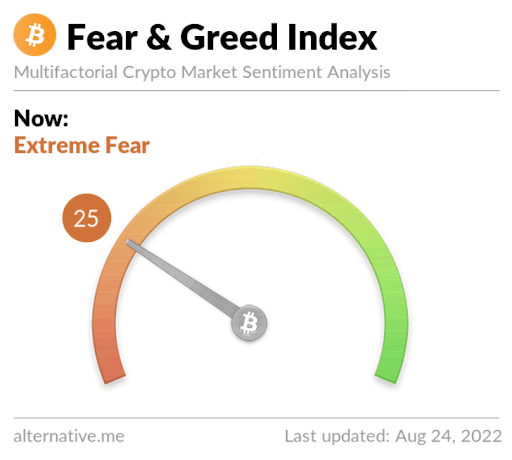
The Fear and Greed Index is 25 Fear and is -3 from Tuesday’s reading of 28 Fear.

BTC’s 24 hour price range is $20,908-$21,685 and its 7 day price range is $20,945.83-$24,438.65. Bitcoin’s 52 week price range is $17,611-$69,044.
The price of Bitcoin on this date last year was $47,940.61.
The average price of BTC for the last 30 days is $22,962.2 and its -6.9% over the same duration.
Bitcoin’s price [+0.62%] closed its daily candle worth $21,526.6 and in green figures for the third time over the last four days.
Ethereum Analysis
Ether’s price climbed higher by over 2% during its daily session on Tuesday and when traders settled-up at the daily close, ETH was +$38.57.
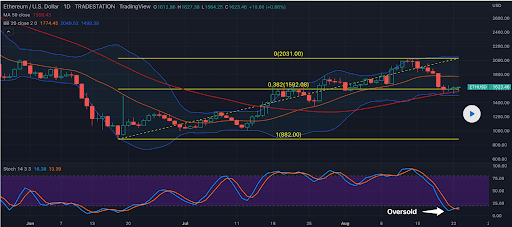
The second chart we’re looking at for this Wednesday is the ETH/USD 1D chart below by TradeStation. ETH’s price is trading back above the $1,600 level, at the time of writing.
Bullish Ether market participants are hoping to use the 0.382 [$1,592.08] as a springboard to go up and retest the $2k level. The overhead target if on ETH is 0 [$2,031.00] if they’re successful in using the 0.382 fib level as support.
Those that are looking for more downside firstly on Ether have targets to the downside of 0.382, followed by 1 [$882.00].

Ether’s Moving Averages: 5-Day [$1,726l.61], 20-Day [$1,743.67], 50-Day [$1,432.87], 100-Day [$1,909.33], 200-Day [$2,627.98], Year to Date [$2,331.62].
ETH’s 24 hour price range is $1,563.76-$1,676.07 and its 7 day price range is $1,556.49-$1,953.96. Ether’s 52 week price range is $883.62-$4,878.
The price of ETH on this date in 2021 was $3,173.35.
The average price of ETH for the last 30 days is $1,704.92 and its +3.91% over the same time frame.
Ether’s price [+2.37%] closed its daily candle on Tuesday worth $1,665.4 and in green figures for a third consecutive day.
Cardano Analysis
Cardano’s price also rallied higher on Tuesday and bullish ADA traders finished up the daily session +$0.0034.
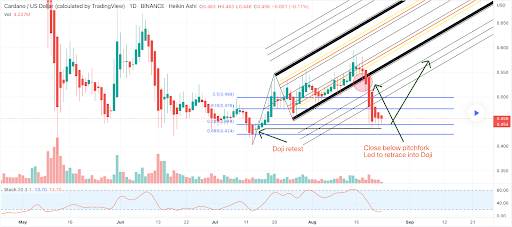
Today’s final project for analysis is Cardano and we’re looking at the ADA/USD 1D chart below from Major-Heikin-Ashi-Legend. ADA’s price is trading between the 0.786 fib level [$0.444] and 0.618 [$0.476], at the time of writing.
Bullish ADA traders want to hold the 0.786 or it may be a quick trip down to test the 0.886 and down thereafter to test ADA’s 12-month low at $0.40. If bulls can muster another rally their overhead targets are 0.618 and 0.5 [$0.499], over the short-term to mid-term.

ADA’s Moving Averages: 5-Day [$0.49], 20-Day [$0.51], 50-Day [$0.48], 100-Day [$0.60], 200-Day [$0.90], Year to Date [$0.78].
ADA’s price is -84.1% against The U.S. Dollar over the last 12 months, -63.51% against BTC, and -68.05% against ETH, over the same duration.
Cardano’s 24 hour price range is $0.464-$0.466 and its 7 day price range is $0.442-$0.579. ADA’s 52 week price range is $0.40-$3.09.
Cardano’s price on this date last year was $2.72.
The average price of ADA over the last 30 days is $0.51 and its -7.62% over the same timespan.
Cardano’s price [+0.75%] closed its daily candle worth $0.4651 and in green figures for the third time over the last four daily candles.
The post Bitcoin, Ethereum, and Cardano Finished with Green Daily Candles on Tuesday appeared first on The Cryptonomist.


