Measuring the economic activity of a market requires looking at more than just the total transaction volume, especially when it comes to assets as specific as Bitcoin. While the number of transactions and transaction volume are both affected by market swings, they aren’t good indicators of future performance.
Given Bitcoin’s position on the market as a long-term investment, Coin Days Destroyed (CDD) is a much better indicator of the market’s general sentiment. Bitcoins held in cold storage as a long-term store of value are considered more important than recently acquired coins, as their movement signals a change in hodler behavior.
Every Bitcoin accumulates one coin day each day that it remains unspent. As soon as the coin is spent, the accumulated days are destroyed and registered by the Coin Days Destroyed (CDD) metric. The metric then shows the number of coins spent in a transaction multiplied by the number of days passed since they were last spent.
For example, a transaction of 0.5 BTC that remained dormant for 100 days has accumulated 50 coin days, while a transaction of 10 BTC that remained dormant for 6 hours accumulates only 2.5 coin days. The larger the CDD metric, the more economically important the transaction is.
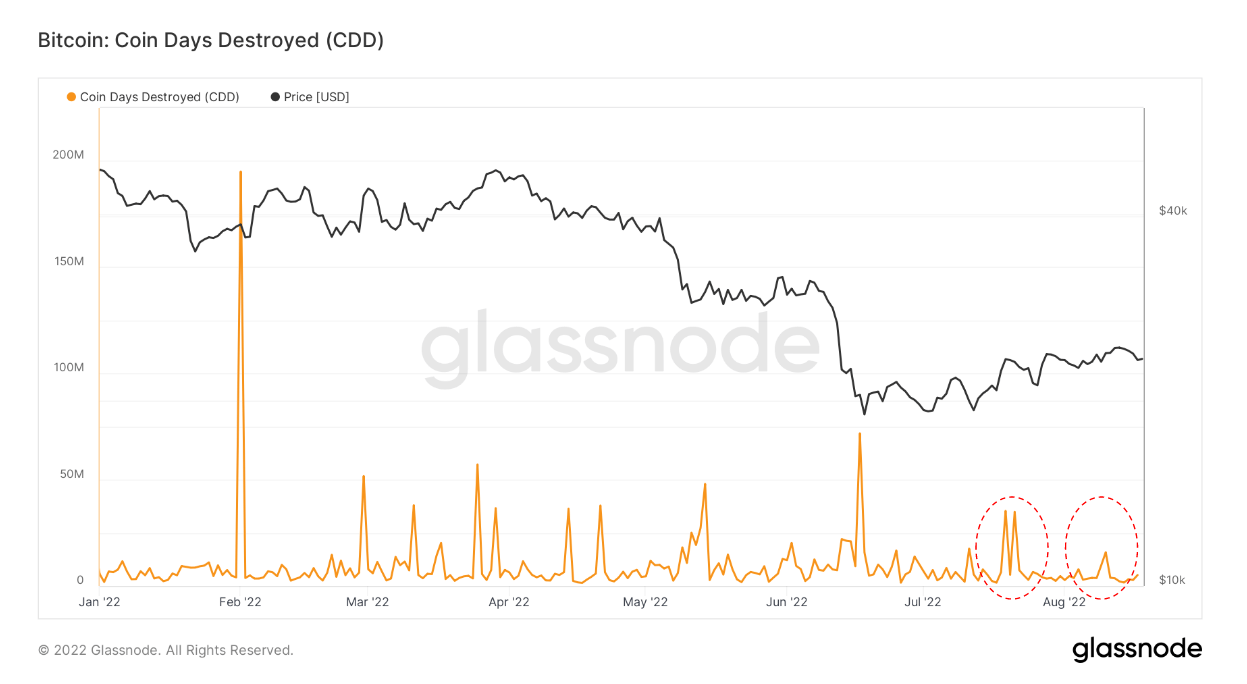
Since the beginning of the year, there have been several large spikes in CDDs. Almost all of these spikes come from increased macro uncertainty and FUD on the market, pushing long-term holders to exit the market and take profits.

The most significant spike in CDD was seen in February 2022, when Russia’s invasion of Ukraine devastated global markets. Fearing a further decline and unwillingness to take on the risk of a prolonged slump, many long-term holders (LTHs) exited their BTC positions. It started a domino effect that dragged the rest of the market down.
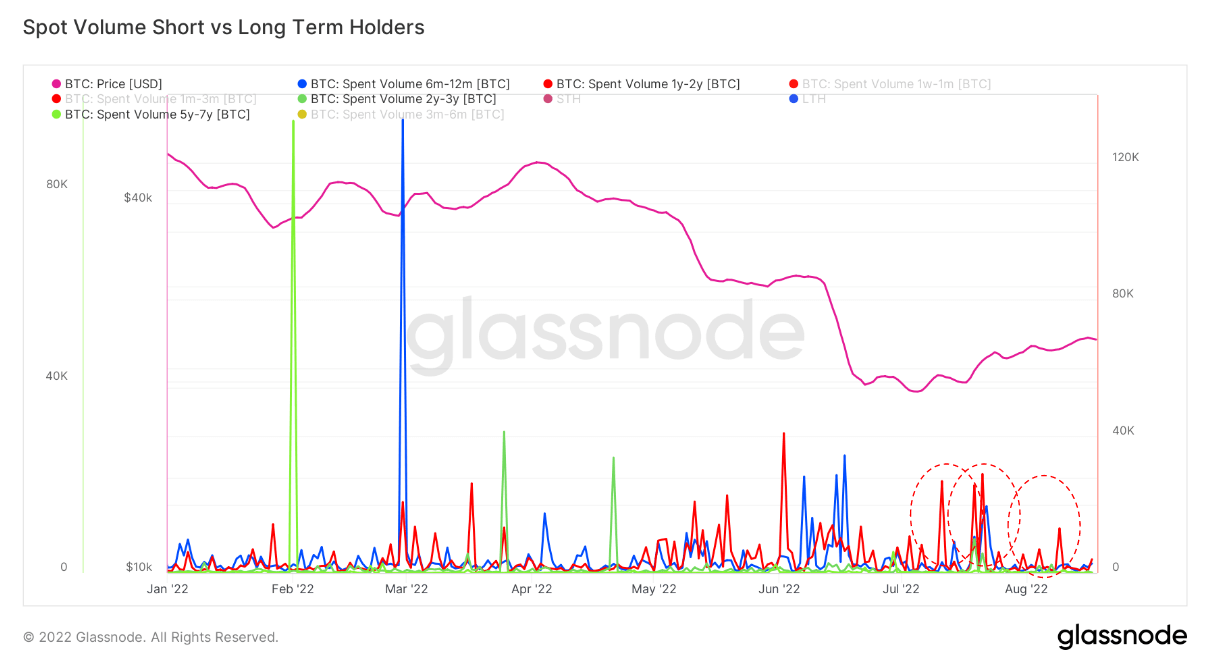
The metric can be broken down even further to show which cohorts have been selling their BTC holdings. Analyzing Bitcoin’s spent volume by age indicates that short-term holders usually initiate the majority of BTC selling — both in bear and bull markets. Looking through the CDD metric, short-term holders are defined as a cohort of coins held for less than 155 days.
However, the latest relief rally that saw Bitcoin break through the $21,000 resistance pushed another cohort to sell their positions. According to data from Glassnode, users that held Bitcoin for between one and two years dominated the most recent Bitcoin sell-off. It’s highly likely that this cohort purchased Bitcoin during a peak in January 2021 and saw their investment lose over 64% of its value.

The data also shows that long-term holders sitting on their Bitcoin for over two years were largely unfazed by the recent relief rally. The only time long-term holders succumbed to the pressure of the market was in June this year when the Terra (LUNA) blowback pushed every cohort to sell.
Nonetheless, long-term holders remained a stabilizing factor during the June sell-off and are still holding the fort as the market enters its third month of a downturn.
The post Research: This metric shows who has been selling Bitcoin in the recent bear market relief rally appeared first on CryptoSlate.


