Bitcoin’s price appears to be preparing for another bearish move after a lengthy period of consolidation between the $20K and $24K levels. With the current price action, a new low is not out of the picture.
Technical Analysis
By: Edris
The Daily Chart
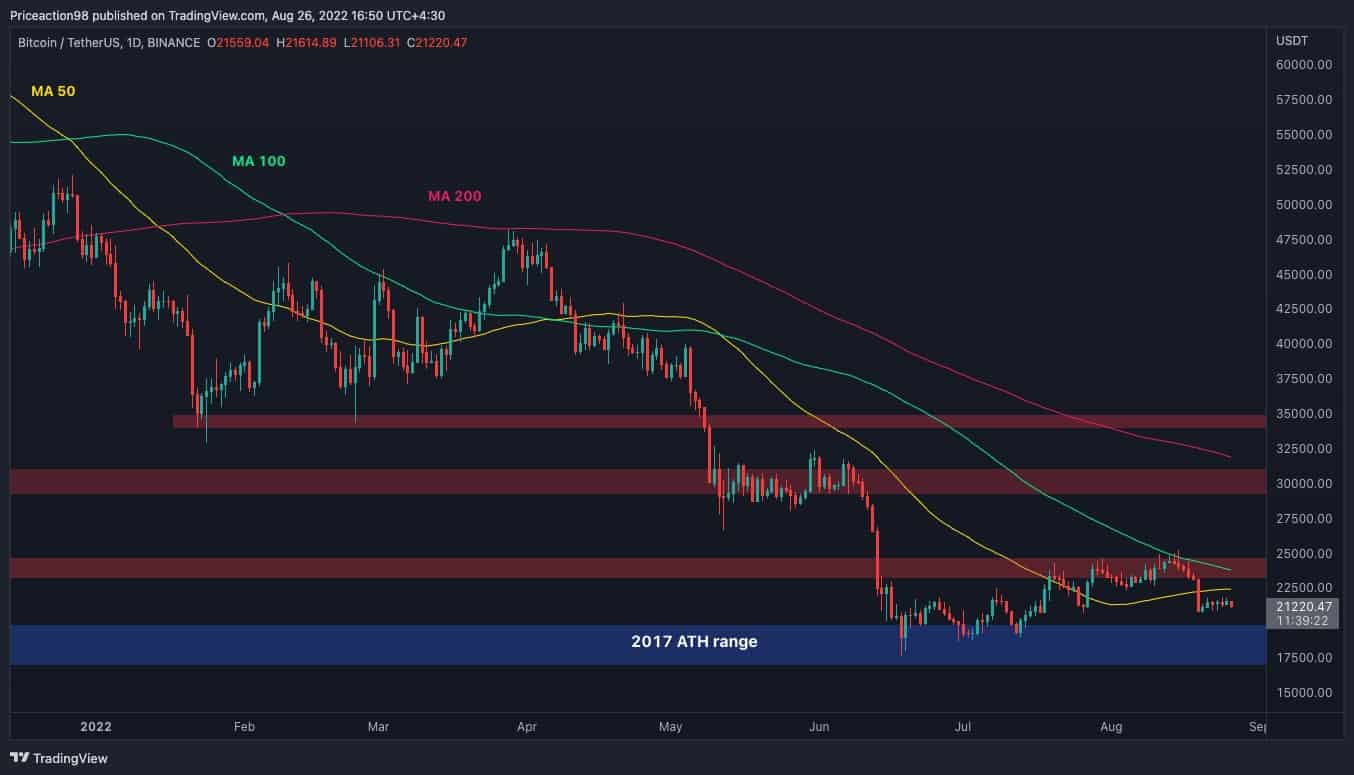
Looking at the daily chart, the price has been consolidating at a very tight range over the last few days. This occurred after a rejection from the $24K level and the 100-day moving average. The price has also broken below the 50-day moving average located at the $22K area and has failed to break back above it. The $17K-$20K support area seems like the next target for the price.
If the market breaks below the previous low around the $18K mark, another rapid drop towards the $15K area and even lower could be expected.
Alternately, if the price breaks the 50-day and the 100-day moving averages to the upside in the next few days, a rally towards $30K would become more likely. However, the bearish scenario seems more probable at the moment.
The 4-Hour Chart
On the 4-hour timeframe, the price is still consolidating at the lower boundary of the large bearish flag. A new smaller bearish flag has been forming over the last week. As a result, a breakdown and continuation below the large flag appear likely to occur in the next few days. In this case, the price could aggressively drop towards the $18K level.
The RSI indicator has recovered from the oversold area recently and is bouncing around the 50 level, indicating that the momentum is in a state of equilibrium right now. However, it could be the calm before the storm as the chart seems very bearish in the short term.

Onchain Analysis
By Shayan
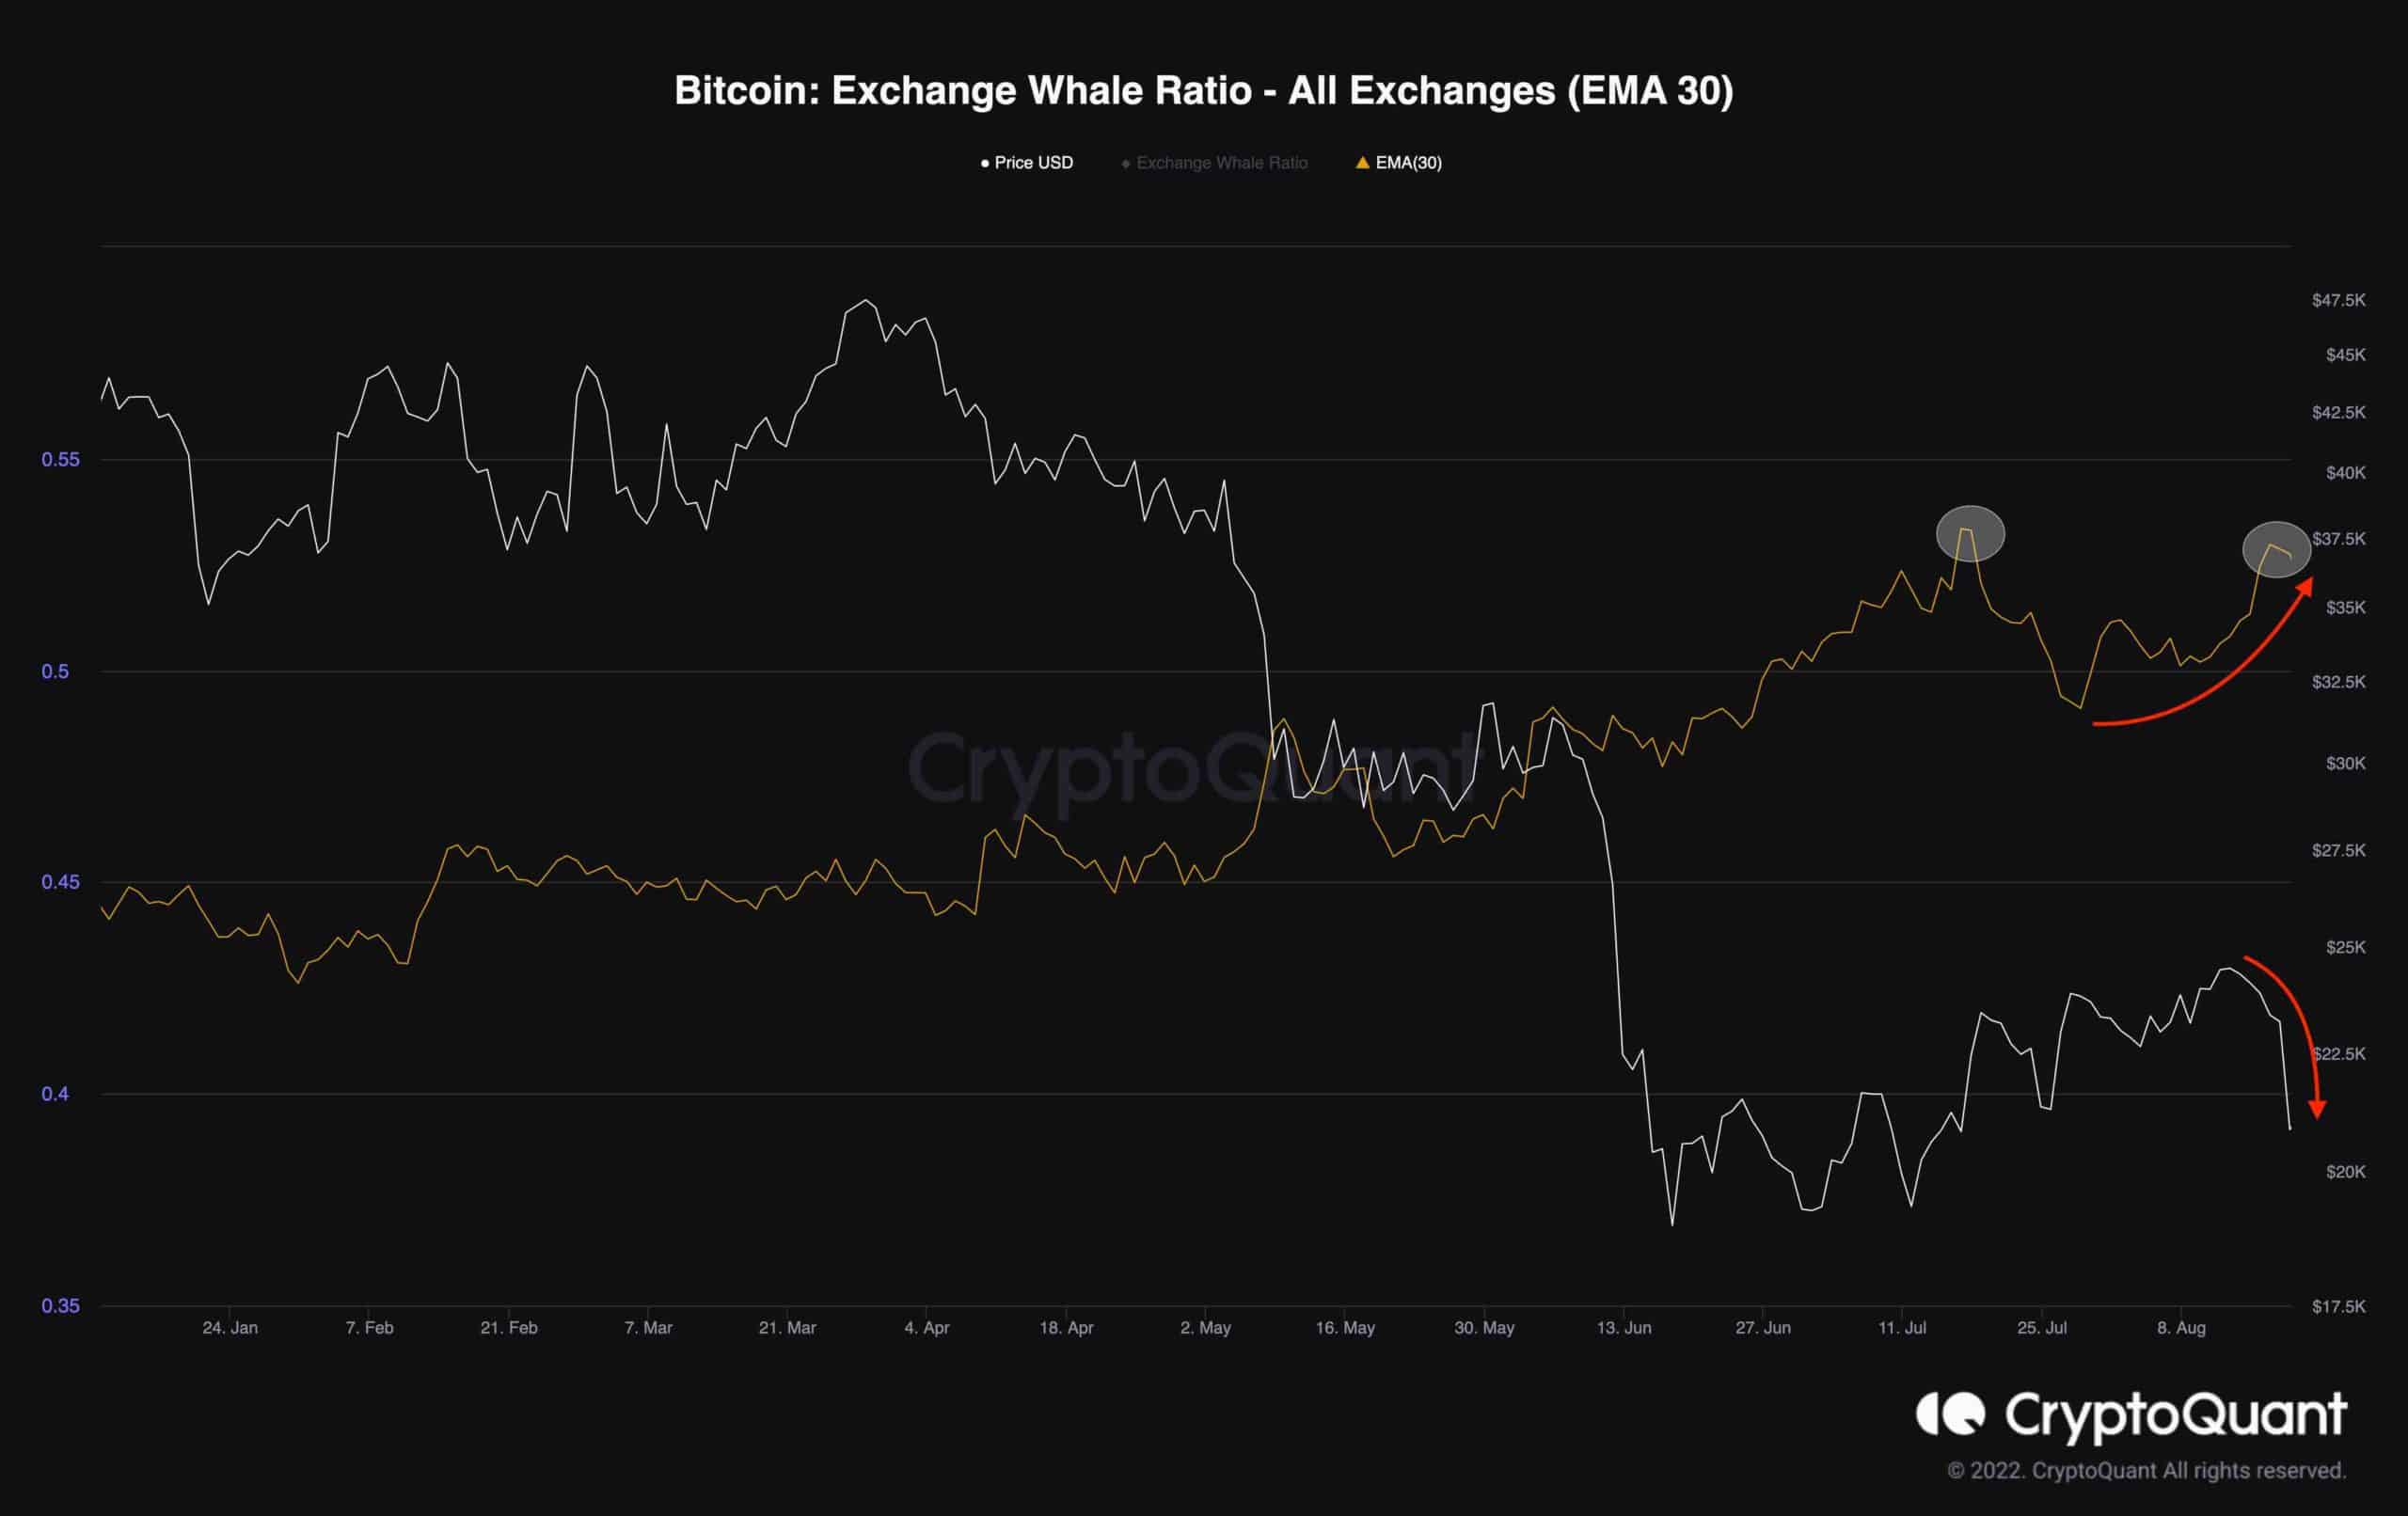
During a bearish market, big players usually offload their assets during the correction phases or when the market experiences a short-term relief rally. The market was experiencing a rally towards the $24K level. Therefore, it provided an excellent chance for the whales to liquidate assets before potentially experiencing another leg down.
The Exchange Whale Ratio metric’s 30-day exponential moving average is a proper tool for monitoring Whales’ activity and it has climbed significantly over the past few weeks. This suggests a considerable increase in Bitcoin deposits to exchanges by whales. This selling pressure and rise in supply have been the leading cause for the recent significant drop in Bitcoin’s price.
The post Is $20K Inbound for Bitcoin Following an 8% Weekly Decline? (BTC Price Analysis) appeared first on CryptoPotato.