Bitcoin Analysis
Bitcoin’s price again suffered on Wednesday upon news by The Federal Reserve’s Chairman, Jerome Powell, that a third consecutive interest rate hike of 0.75 percentage point has been greenlit and is forthcoming. Following the news, when traders settled-up at BTC’s session close on Wednesday, BTC’s price was -$385.5.
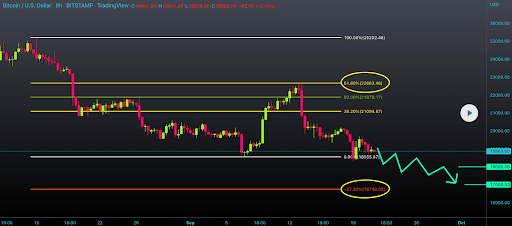
The BTC/USD 8HR chart from Alex_master_forex is the first chart we’re examining for this Thursday. BTC’s price is trading between 0.00% [$18,555.87] and 38.20% [$21,094.87], at the time of writing.
The targets on BTC for bullish market participants to the upside of the 8HR chart are 38.20%, 50.00% [$21,879.17], 61.80% [$22,663.46], and 100.00% [$25,202.46].
Bearish traders are conversely taking aim at the 0.00% fib level with a secondary target of $17,611 [BTC’s 12-month low]. If bearish traders can send BTC’s price to a fresh low for 2022, their next aim is -27.20% [$16,748.00].

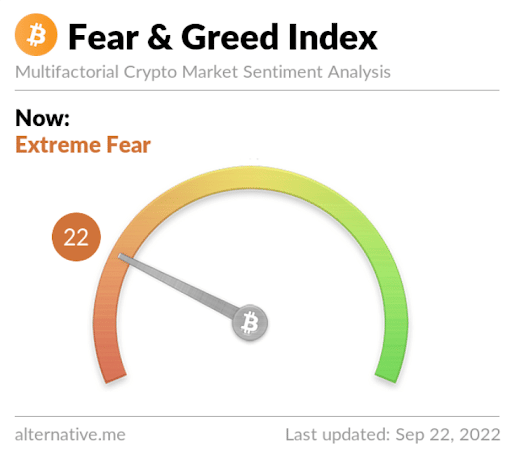
The Fear and Greed Index is 22 Extreme Fear and is -1 from Wednesday’s reading of 23 Extreme Fear.

Bitcoin’s Moving Averages: 5-Day [$19,461.81], 20-Day [$20,069.52], 50-Day [$21,712.35], 100-Day [$23,814.81], 200-Day [$32,973.89], Year to Date [$31,986.72].
BTC’s 24 hour price range is $18,126-$19,956 and its 7 day price range is $18,126-$20,201.58. Bitcoin’s 52 week price range is $17,611-$69,044.
The price of Bitcoin on this date last year was $43,536.1.
The average price of BTC for the last 30 days is $20,300.2 and its -7.6% over the same time frame.
Bitcoin’s price [-2.04%] closed its daily candle on Wednesday worth $18,489.3 and in red figures for the third time over the last four days.
Ethereum Analysis
Ether’s price has lost 20.8% of its value over the last 30 days and Wednesday saw another sharp markdown on ETH’s price. When traders had wrapped-up trading for Wednesday’s daily session, ETH’s price was -$75.42.
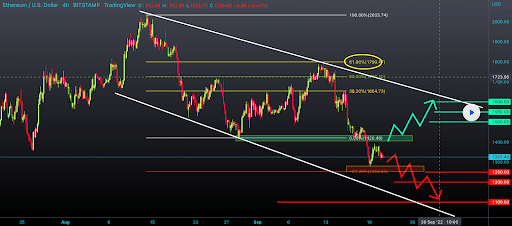
The ETH/USD 4HR chart by Alex_master_forex is the second chart we’re looking at today. ETH’s price is trading between the -27.20% fibonacci level [$1,253.64] and 0.00% [$1,420.46], at the time of writing.
If bullish Ether traders can regain the 0.00% fib level, their targets then shift to 38.20% [$1,654.73], 50.00% [$1,797.1], 61.80% [$1,799.47], and 100.00% [$2,033.74].
Bearish ETH traders wish to break the -27.20% fib level before sending Ether’s price back to triple figures.

Ether’s Moving Averages: 5-Day [$1,397.37], 20-Day [$1,560.25], 50-Day [$1,615.77], 100-Day [$1,608.15], 200-Day [$2,346.85], Year to Date [$2,246.15].
ETH’s 24 hour price range is $1,220-$1,408.9 and its 7 day price range is $1,220-$1,634.95. Ether’s 52 week price range is $883.62-$4,878.
The price of ETH on this date in 2021 was $3,077.76.
The average price of ETH for the last 30 days is $1,562.88.
Ether’s price [-5.70%] closed its daily session on Wednesday valued at $1,247.9 and in red digits also for a third time over the last four daily candles.
XRP Analysis
XRP’s price also pulled-back more than 5% on Wednesday and concluded its daily session -$0.0208.
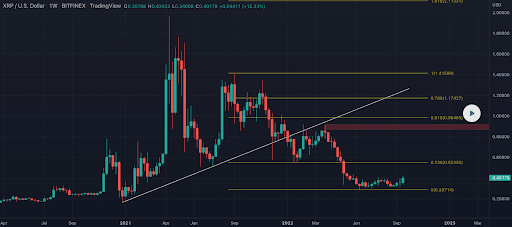
The last chart we’re analyzing for this Thursday is the XRP/USD 1W chart below from crytobullmike. Ripple’s price is trading between the 0 fib level [$0.28714] and 0.236 [$0.55350], at the time of writing.
The targets above for bullish XRP traders are 0.236, 0.618 [$0.98465], 0.786 [$1.17427], and 1 [$1.41580].
Bearish traders have an aim of a full retracement on the weekly timescale for XRP, which is to send its price back to the $0.28 level before sending it to a fresh 52 week low.

XRP’s Moving Averages: 5-Day [$0.37], 20-Day [$0.344], 50-Day [$0.355], 100-Day [$0.368], 200-Day [$0.565], Year to Date [$0.544].
Ripple’s 24 hour price range is $0.38-$0.434 and its 7 day price range is $0.324-$0.434. XRP’s 52 week price range is $0.2876-$1.3462.
Ripple’s price on this date last year was $1.00.
The average price of XRP over the last 30 days is $0.34608 and its +17.53% over the same period.
XRP’s price [-5.01%] closed its daily candle on Wednesday worth $0.394 and in red figures for the first time in three days.
The post Bitcoin (18k), Ethereum (1.2k), and XRP suffered losses on Wednesday appeared first on The Cryptonomist.


