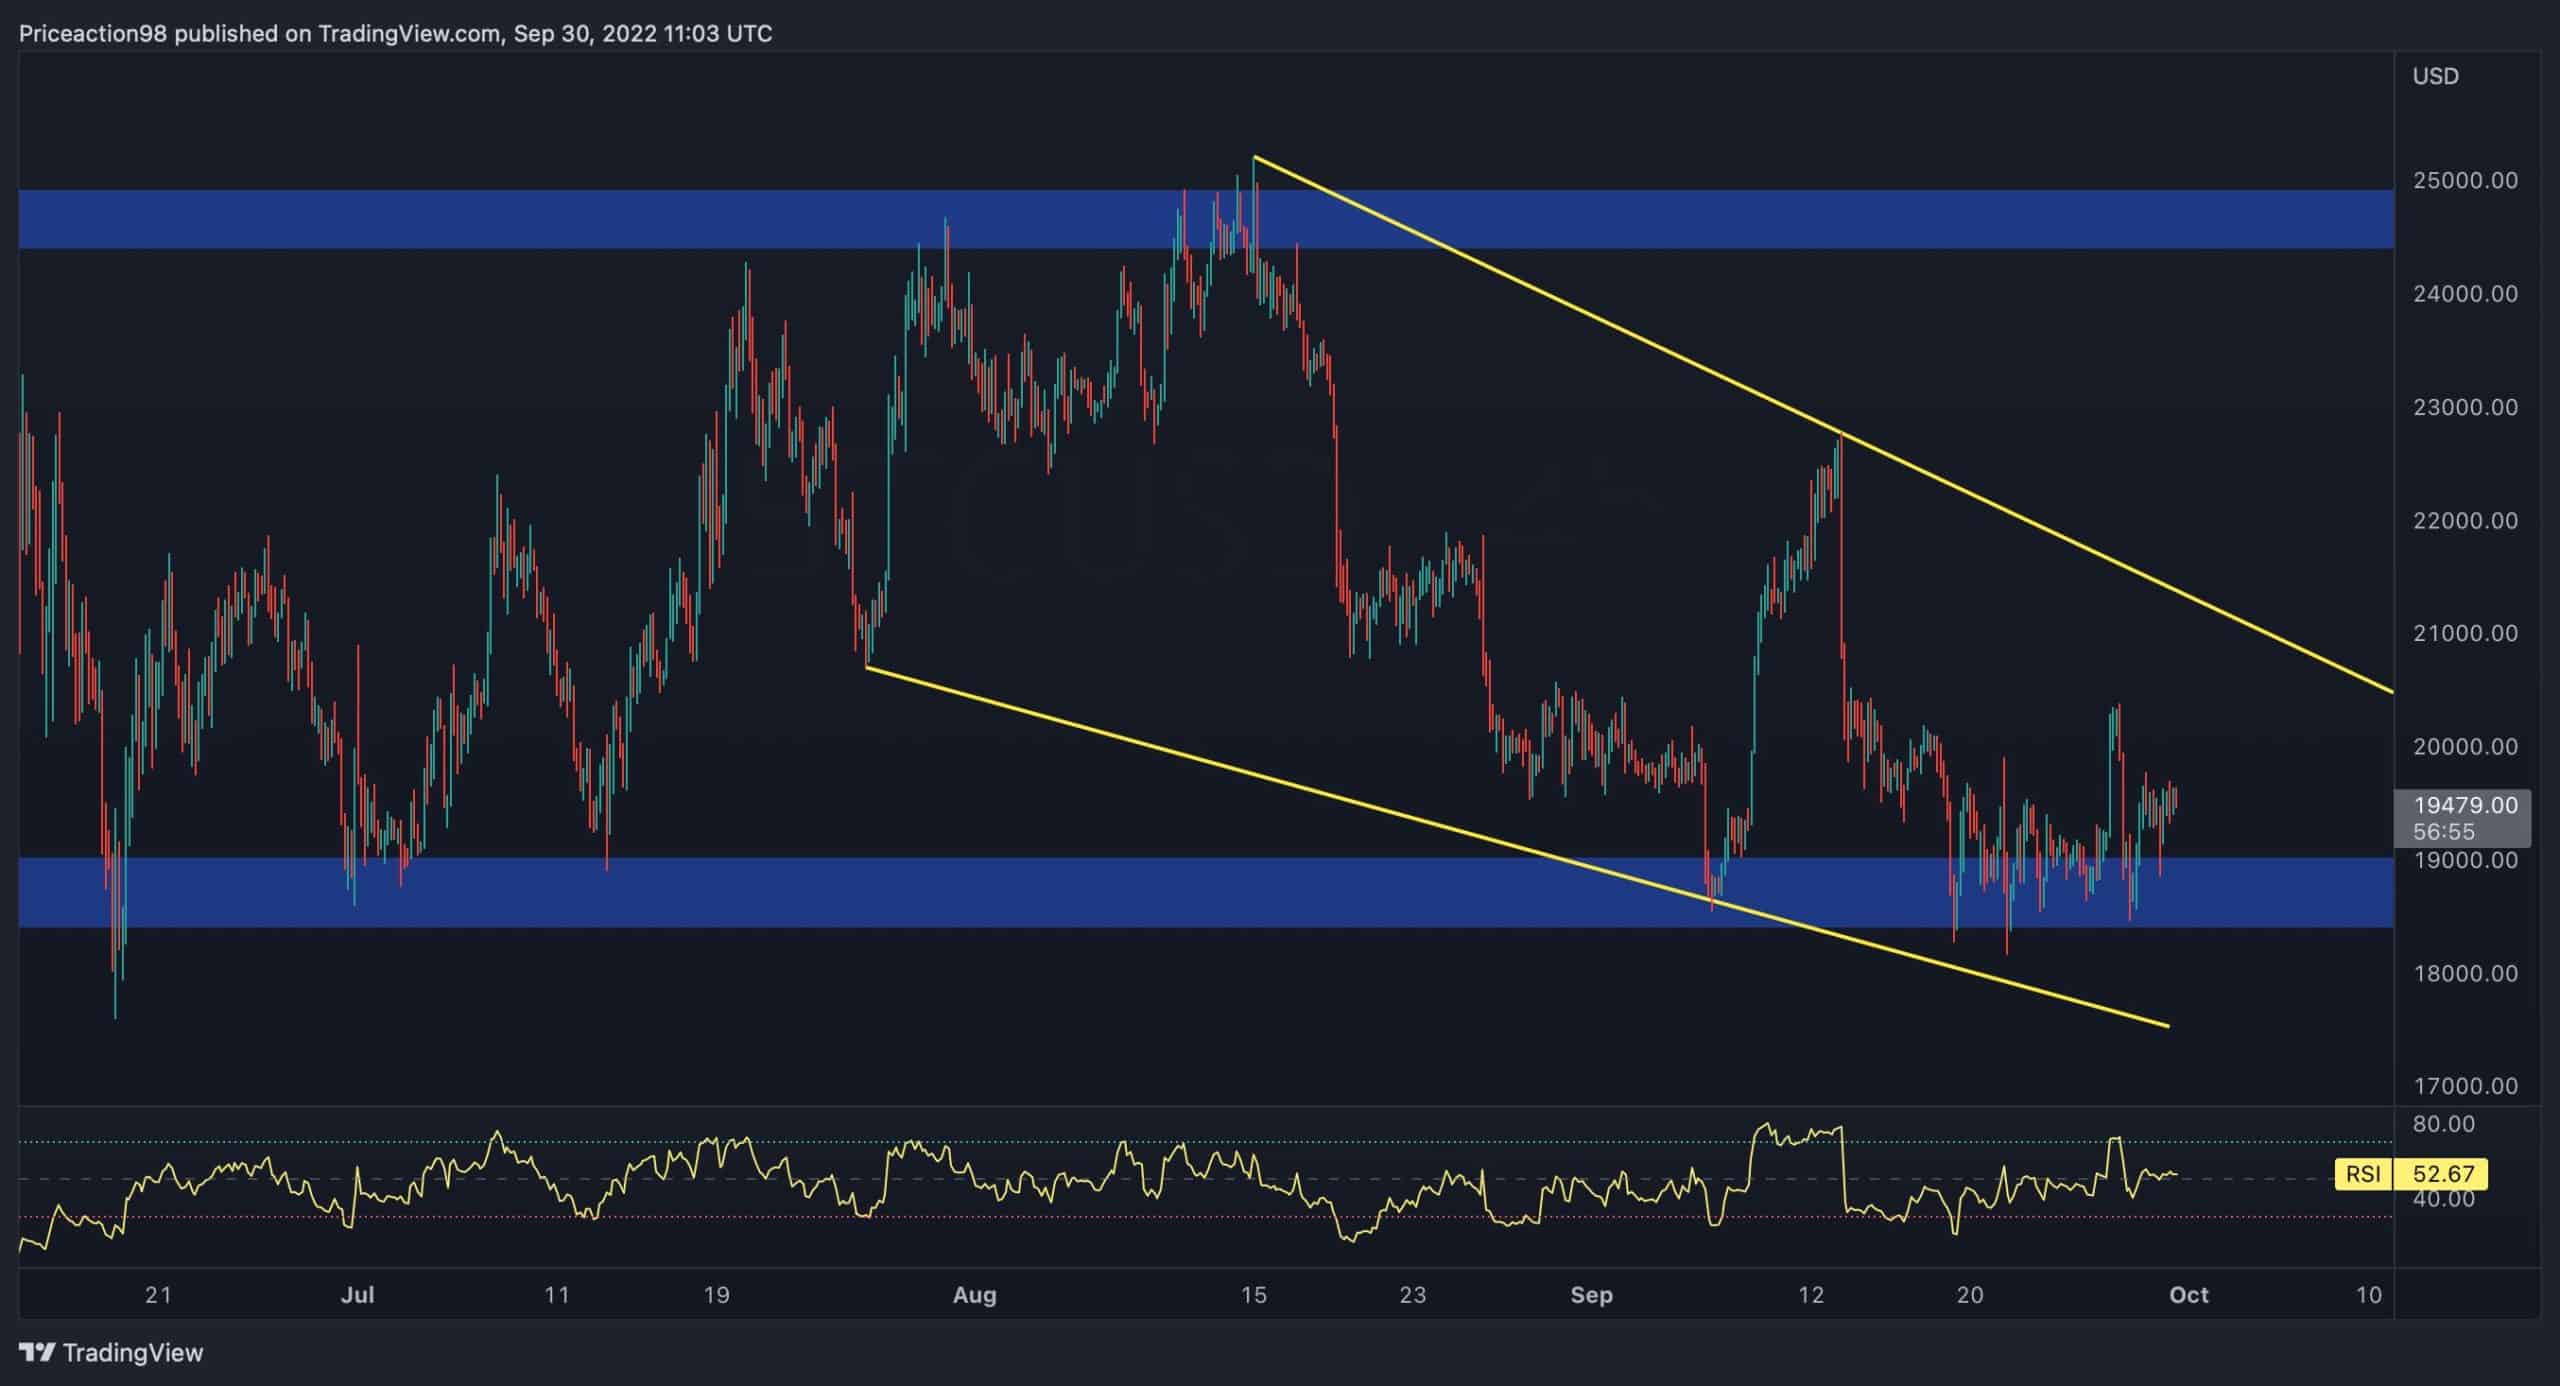
Bitcoin’s bearish period still seems far from over as the price has been trapped in a consolidation region between $18K and $25K for the past four months. However, BTC is closer to breaking down the lower boundary, as it seems recently.
Technical Analysis
By Shayan
The Daily Chart
The 100-day moving average line, currently at $21.2K, has been acting as significant resistance to the price. In comparison, the $18K substantial support level remains the most critical price point for Bitcoin and has prevented further decline.
On the other hand, evidence of bullish divergence is seen between the price and the RSI indicator, indicating a potential rebound from this level. Therefore, Bitcoin will likely retest the multi-month bearish trendline and both the 100-day and 200-day moving average lines before a possible downside continuation.
If BTC can break above these dynamic resistance levels, a rally towards $24K could be expected. In contrast, if the $18K support is breached, a rapid decline towards $15K will likely occur.
The 4-Hour Chart
As on the daily chart, on the 4-hour timeframe, the price has been consolidating between the $18K significant support level and the $25K critical resistance level, forming a descending wedge pattern. Bitcoin must break the wedge’s upper boundary to reach $25K.
Considering the strength of the $18K support, a rebound towards the wedge’s upper threshold and a continuation of the consolidation stage seems likely.
Additionally, the RSI indicator currently stands at 52, indicating a balance between buyers and sellers.
On-chain Analysis
By: Edris
Exchange Inflow Spent Output Age Bands (SOAB) 6-12 months
During the later phases of bear markets, even seasoned investors tend to capitulate out of anxiety and sell their coins at huge losses to prevent larger ones.
The flip side of this trade is usually the “smart money,” a cohort of market participants with clear long-term strategies and deep enough pockets to accumulate cheap coins during a gruesome downtrend.
A bear market continues until enough retail investors have capitulated, supply dries out, and it finally ends once demand becomes more dominant again. So, capitulations are key events that could help us narrow the timeframe in which we expect the price bottom to form.
One of the most valuable metrics to measure this trend is the Exchange Inflow SOAB metric, which demonstrates the age of coins being deposited and sold on the exchanges. Looking at the chart, it is evident that coins aged between 6-18 months have been sold aggressively recently. These coins were bought between April 2021 and April 2022 at prices above $30K.
This signifies that many holders who have entered during the bull market and above the $30K mark have recently capitulated and exited the market at an approximate 50% loss. These types of capitulations tend to occur during the last months of a bear market, pointing to a potential bottom formation in the near future.
The post Bitcoin Price Analysis: High Probability of Bullish Correction, According to this Indicator appeared first on CryptoPotato.


