Bitcoin Analysis
On Tuesday, Bitcoin’s price closed at its lowest level on the daily time frame since September 25th and was -$75.4 for its trading session.
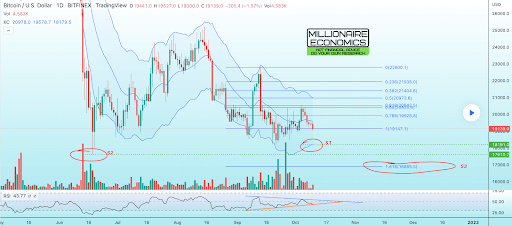
Today we’re leading off our price analyses as always with Bitcoin and the BTC/USD 1D chart from MillionaireEconomics. BTC’s price is trading between the 1.618 fibonacci level [$16,889.5] and 1 [$19,147.1], at the time of writing.
For over a month $19,891 has been a inflection point battleground and bullish traders need to regain that level and then the 0.786 [$19,928.8] to again show signs of strength. If they successfully regain those levels, their targets are then 0.65 [$20,425.6], 0.618 [$20,542.5], 0.5 [$20,973.6], 0.382 [$21,404.6], 0.236 [$21,938.0], and the 0 fib level [$22,800.1] which is where the most recent bullish uptrend suffered a breakdown.
Those traders short the BTC market are looking to again send BTC’s price below the $19k level with a secondary aim of the 1.618 [$16,899.5] which is the 12-month low on the BITFINEX chart.
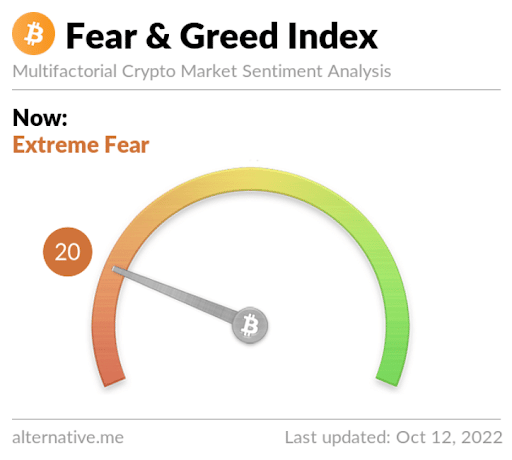
The Fear and Greed Index is 20 Extreme Fear and is -4 from Tuesday’s reading of 24 Extreme Fear.
Bitcoin’s Moving Averages: 5-Day [$19,609.62], 20-Day [$19,486.94], 50-Day [$20,854.28], 100-Day [$22,253.97], 200-Day [$30,968.48], Year to Date [$31,118.75].
BTC’s 24 hour price range is $18,860-$19,268.1 and its 7 day price range is $18,860-$20,420.51. Bitcoin’s 52 week price range is $17,611-$69,044.
The price of Bitcoin on this date last year was $55,967.
The average price of BTC for the last 30 days is $19,708.9 and its -10.2% over the same period.
Bitcoin’s price [-0.39%] closed its daily candle worth $19,059.2 on Tuesday and in red figures for the sixth time over the last seven days.
Ethereum Analysis
Ether’s price continued its downtrend by less than 1% during Tuesday’s daily candle and when traders settled-up at ETH’s session close, ETH’s price was -$10.07.
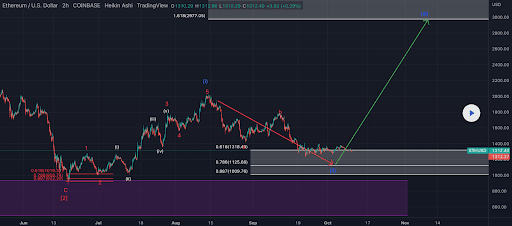
The ETH/USD 2HR chart below by DavidJankowski is the second chart for analysis today. ETH’s price is trading between the 0.786 fib level [$1,125.68] and 0.618 [$1,318.49], at the time of writing.
The overhead targets for bullish Ether market participants on their attempt to regain arguably ETH’s most important level of inflection [$1,400] are 0.618 and 1.618 [$2,977.05].
Bearish ETH traders are conversely attempting to send ETH’s price below the 0.786 with a secondary aim of 0.887 [$1,009.76].
Ether’s Moving Averages: 5-Day [$1,327.40], 20-Day [$1,358.87], 50-Day [$1,559.78], 100-Day [$1,493.35], 200-Day [$2,166.55], Year to Date [$2,182.49].
ETH’s 24 hour price range is $1,267.01-$1,298 and its 7 day price range is $1,267.01-$1,383.46. Ether’s 52 week price range is $883.62-$4,878.
The price of ETH on this date in 2021 was $3,489.
The average price of ETH for the last 30 days is $1,393.1 and its -25.34% over the same time frame.
Ether’s price [-0.78%] closed its daily session on Tuesday worth $1,279.96 and in red figures for the fourth time in five days.
Avalanche Analysis
Avalanche’s price is -21.56% over the last 30 days [at the time of writing] and AVAX finished Tuesday’s trading session -$0.24.
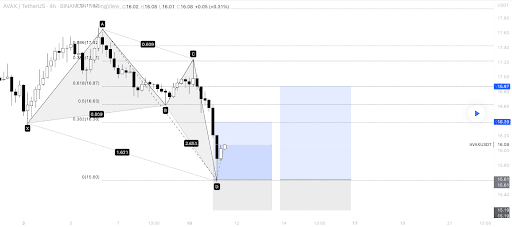
The last chart we’re looking at today is the AVAX/USD 4HR chart from hananbutt. AVAX’s price is trading between the 0 fib level [$15.60] and 0.382 [$16.38], at the time of writing.
Avalanche’s price hasn’t seen many bids from bulls over the last month and risk making a fresh 12-month low soon if they don’t pivot to the upside. Their targets above are 0.382, 0.5 [$16.63], 0.618 [$16.87], 0.786 [$17.21], and 0.886 [$17.42].
Those that want to see Avalanche continue its current downtrend want to push AVAX’s price below the 0 fibonacci level for a full retracement before their secondary aim of challenging its 12-month low of $13.75.
Avalanche’s Moving Averages: 5-Day [$16.79], 20-Day [$17.31], 50-Day [$20.74], 100-Day [$20.85], Year to Date [$34.61].
AVAX’s price is -71.13% against The U.S. Dollar over the last 12 months, -13.72% against BTC, and -20.36% against ETH over the same timespan.
Avalanche’s 24 hour price range is $15.74-$16.32 and its 7 day price range is $15.74-$17.62. AVAX’s 52 week price range is $13.75-$146.29.
Avalanche’s price on this date last year was $54.30.
The average price of AVAX over the last 30 days is $17.66 and its -20.51% for the same stretch.
Avalanche’s price [-1.48%] closed its daily session on Tuesday worth $15.96 and in red digits for the six time in seven days.
The post Bitcoin (19k, Ethereum (1,2k), Avalanche Price Analyses appeared first on The Cryptonomist.