Ripple is currently in a correction following the recent positive price action. At the time of writing, XRP has lost around 17% of its value in the last ten days after failing to break above a long-lasting resistance level.
Technical Analysis
By Grizzly
The Daily Chart
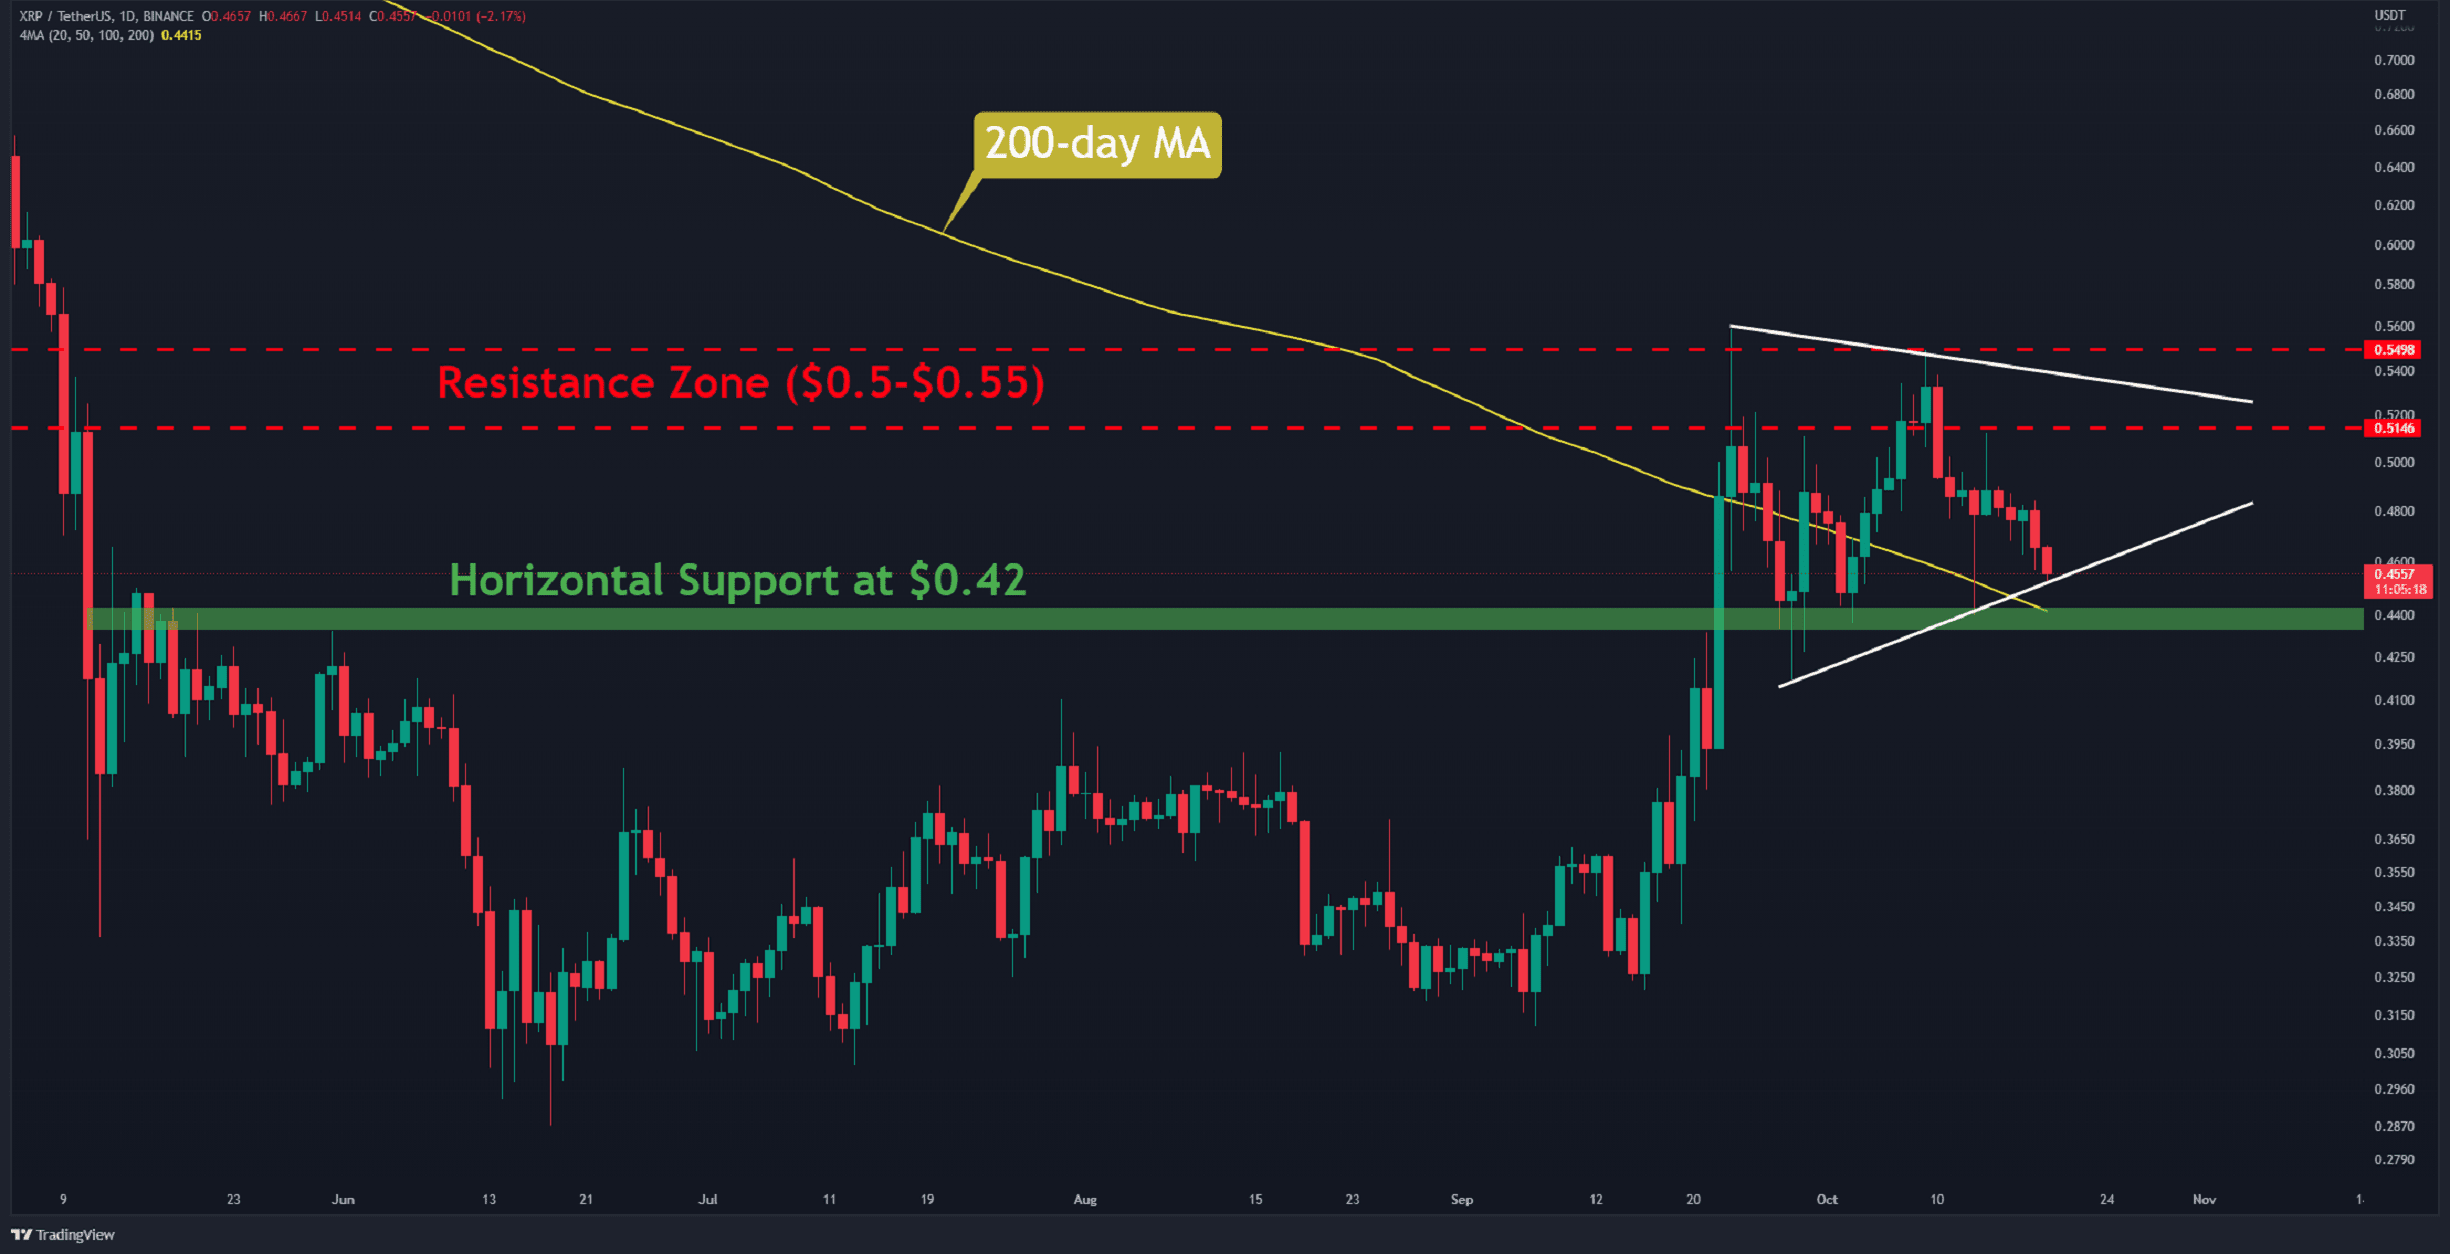
XRP began its decline after failing to break through the overhead resistance zone at $0.5-$0.55 (in red) in two separate attempts. As a result, the bullish momentum faded, leading the pair into a symmetrical triangle structure (in white).
If the asset retests the horizontal support level of $0.42 (in green), it will come into contact with the 200-day moving average (in yellow). If the price slips below these critical levels, the reversal of the upward trend will be confirmed, placing the next support at around $0.35.
Alternatively, flipping the red resistance zone could bring back the diminishing positive momentum to the market, which might drive the price to $0.7.
Key Support Levels: $0.42 & $0.35
Key Resistance Levels: $0.55 & $0.70
Daily Moving Averages:
MA20: $0.48
MA50: $0.42
MA100: $0.39
MA200: $0.44
The XRP/BTC Chart
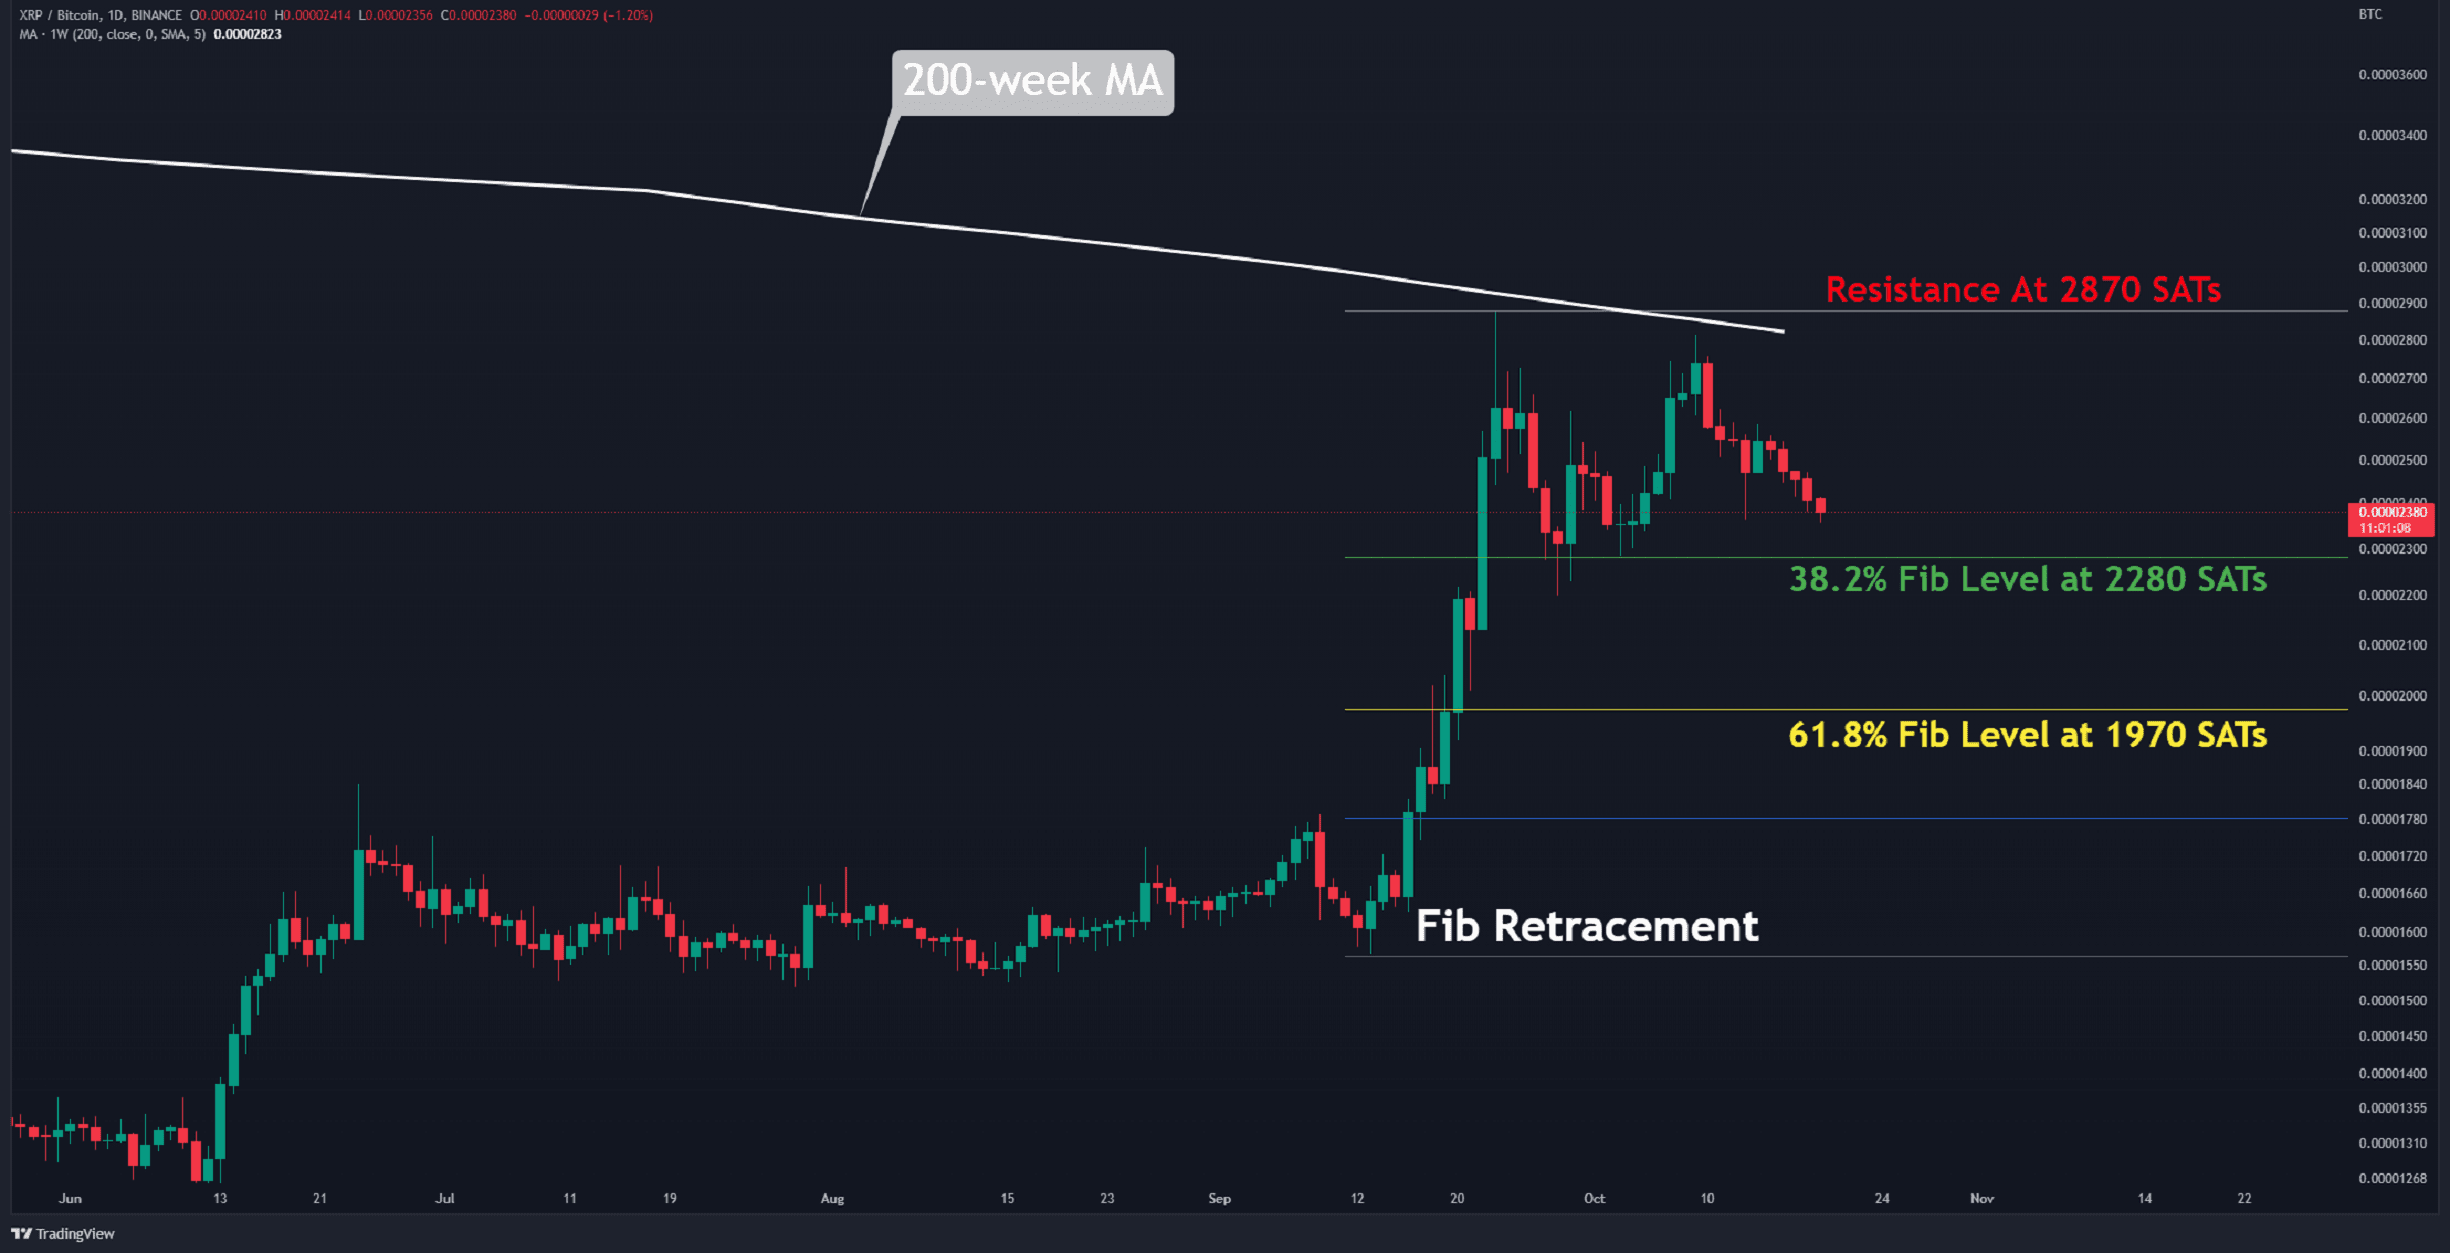
Against Bitcoin, the buyers’ attempt to push the price above the 200-week moving average (in white) was unsuccessful. This hurdle is currently around 2870 SATs. The most probable support areas are shown on the chart.
The 38.2% Fib level at 2280 SATs is the initial support (in green). A break and close below it could result in the formation of a lower low, which could technically signal the reversal of the trend. If this happens, the next level of support is found at 61.8% Fib, which is sitting at 1970 SATs.
Key Support Levels: 2280 SATs & 1970 SATs
Key Resistance Levels: 2600 SATs & 2870 SATs
The post XRP Crashes 17% in 10 Days but is the Worst Yet to Come? (Ripple Price Analysis) appeared first on CryptoPotato.