Despite the bear market, some cryptos seem to bounce from their bottom: let’s analyze together the price of Bitcoin, Ethereum and Cardano.
Bitcoin Analysis
Bitcoin’s price marked-up again on Wednesday and when the day’s candle was printed, BTC’s price was +$404.
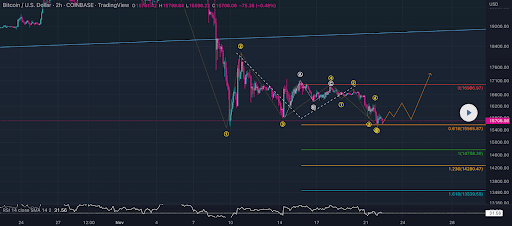
The BTC/USD 2HR chart below by MrBurns21 is the first chart we’re analyzing for this Thursday. BTC’s price is trading between the 0.618 fibonacci level [$15,565.87] and 0 fib level [$16,966.97], at the time of writing.
On the 2HR timescale bullish BTC market participants are trying to signal some strength and reclaim territory above the 0 fibonacci level. If they can achieve that aim, they may be able to signal some sort of reversal to the upside even though it’s on a high time frame.
Conversely, bearish targets to the downside to continue their technical damage on the chart are 0.618, 1 [$14,758.3], 1.236 [$14,280.47], and the 1.618 fib level [$13,359.59].

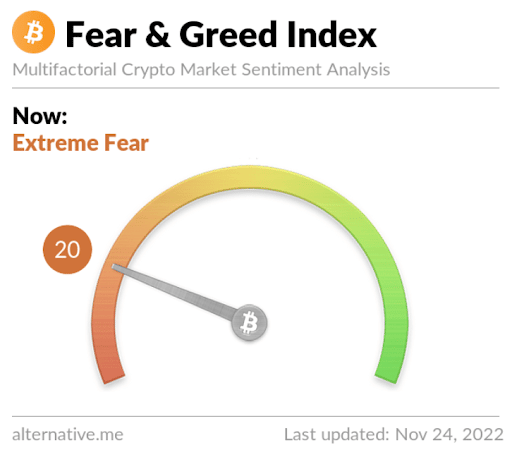
The Fear and Greed Index is 20 Extreme Fear and is -2 from Wednesday’s reading of 22 Extreme Fear.

Bitcoin’s Moving Averages: 5-Day [$16,306.36], 20-Day [$18,226.5], 50-Day [$18,969.87], 100-Day [$20,397.77], 200-Day [$27,502.44], Year to Date [$29,462.18].
BTC’s 24 hour price range is $16,168-$16,682 and its 7 day price range is $15,665.73-$16,945.24. Bitcoin’s 52 week price range is $15,501-$59,423.4.
The price of Bitcoin on this date last year was $57,209.
The average price of BTC for the last 30 days is $18,601.7 and its -14.4% over the same interval.
Bitcoin’s price [+2.49%] closed its daily candle worth $16,619 and in green figures for a second consecutive day on Wednesday.
Ethereum Analysis
Bullish Ether market participants pushed ETH’s price higher again on Wednesday and it finished its daily session +$46.01.
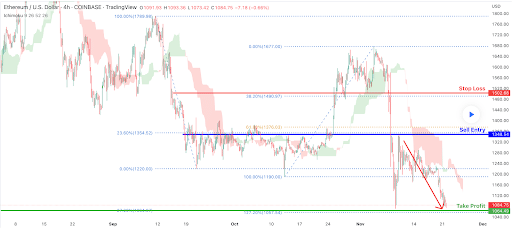
The second chart we’re looking at today is the ETH/USD 4HR chart from FXCM. At the time of writing, ETH’s price is tucked between the 127.20% fib level [$1,057.54] and 100.00% [$1,190.00].
The aim of bullish ETH market participants is to regain the 100.00% fib level with targets after that level of 61.80% [$1,376.03], 38.20% [$1,490.97], and a full retrace at the 0.00% fibonacci level [$1,677.00].
Those that are shorting ETH yet, have their sights set on cracking the 127.20% fib level with a secondary aim of pushing Ether’s price back to three figures. The third target to the downside on ETH is the 12-month low of $883.62.

Ether’s Moving Averages: 5-Day [$1,159.71], 20-Day [$1,350.75], 50-Day [$1,347.58], 100-Day [$1,469.21], 200-Day [$1,914.38], Year to Date [$2,071.54].
ETH’s 24 hour price range is $1,127.75-$1,190 and its 7 day price range is $1,082.89-$1,227.95. Ether’s 52 week price range is $883.62-$4,778.
The price of ETH on this date in 2021 was $4,270.
The average price of ETH for the last 30 days is $1,373.51 and its -10.68% over the same duration.
Ether’s price [+4.04%] closed its daily session on Wednesday valued at $1,185.79.
Cardano Analysis
Cardano’s price was also sent over 2% higher by bullish traders on Wednesday and when traders settled-up to close the daily session, ADA’s price was +$0.0063.
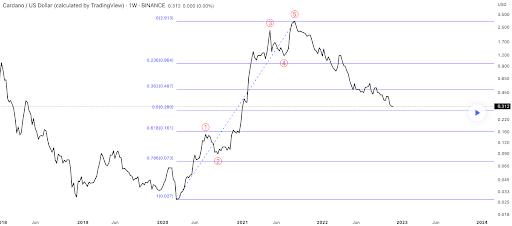
The ADA/USD 1W chart below from Swoop6 is the final chart to conclude our price analyses for this Thursday. ADA’s price is trading between the 1 fibonacci level [$0.027] and 0.786 [$0.073] on the weekly time frame, at the time of writing.
From the perspective of bullish ADA market participants, they want to again regain the 0.786 fib level with a secondary target of 0.618 [$0.161]. The targets above that level are 0.5 [$0.280], 0.382 [$0.487], 0.236 [$0.964], and a full retrace at 0 [$2.913].
At variance with the bullish perspective are those still shorting the ADA market. Their targets are to break the 1 fibonacci level and then send ADA’s price back below $0.02.

Cardano’s 24 hour price range is $0.309-$0.32 and its 7 day price range is $0.299-$0.333. ADA’s 52 week price range is $0.296-$1.75.
Cardano’s price on this date last year was $1.66.
The average price of ADA over the last 30 days is $0.364 and its -9.22% over the same time frame.
Cardano’s price [+2.02%] closed its daily candle worth $0.3188 and in positive figures for the second day in a row.


