Bitcoin Analysis
Bitcoin’s price closed above the $17k level for the fifth consecutive day and when trading concluded for Monday, BTC’s price was +$119.
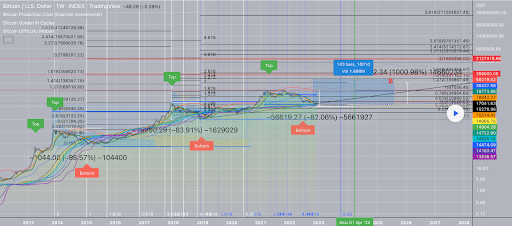
The BTC/USD 1W chart by Blorenz is the first chart we’re delving into for this Tuesday. At the time of writing, BTC’s price is trading between the 0.5 fibonacci level [$14,528.63] and the 0.618 fib level [$20,880.50].
Bullish BTC market participants have been unable to lift BTC’s price above the $17k level recently but they’ll need to crack the $18k threshold firstly on their way to test the 0.618 fib level or further downside may be imminent. The targets above the 0.618 fib level are 0.786,[$34,994.64], 1 [$67,556.46] and the 1.272 fib level [$155,867.48] on the weekly timescale.
At variance with the bullish plot are bearish traders that want to continue their larger move to the downside. After controlling BTC’s price action for the majority of 2022, bearish traders are aiming at continuing that trend in 2023. Their targets below on BTC are the 0.5 fib level, 0.382 [$10,109.00], and a full retracement at 0 [$3,124.51] which was the bottom for BTC’s price during the previous bear market.

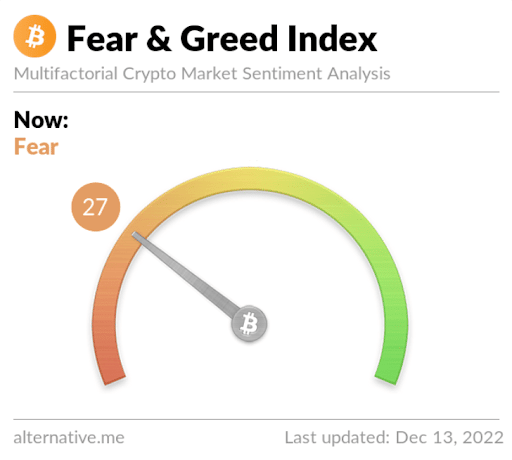
The Fear and Greed Index is 27 Fear and is equal to Monday’s reading.

Bitcoin’s Moving Averages: 5-Day [$17,024.35], 20-Day [$16,692.15], 50-Day [$18,319.44], 100-Day [$19,781.10], 200-Day [$25,999.38], Year to Date [$28,794.99].
BTC’s 24 hour price range is $16,869.54-$17,263 and its 7 day price range is $16,781.78-$17,263. Bitcoin’s 52 week price range is $15,501-$52,027.
The price of Bitcoin on this date last year was $46,777.
The average price of BTC for the last 30 days is $16,739.9 and its -3.2% over the same interval.
Bitcoin’s price [+0.70%] closed its daily candle worth $17,228 and in green figures for the first time in four days on Monday.
Ethereum Analysis
Ether’s price has alternated between green and red daily candles for the last 13 days and when traders settled-up on Monday, ETH’s price was +$11.59.
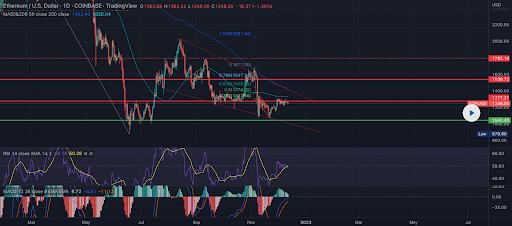
The second chart we’re looking at today is the ETH/USD 1D chart below from SierrasTrades. Ether’s price continued to consolidate above the $1,200 level during Monday’s trading session.
The targets for ETH bulls to the upside are 0.382 [$1,302.56], 0.5 [$1,374.05], 0.618 [$1,445.55] 0.786 [$1,547.34], and the 1 fib level [$1,677.00].
Those that believe ETH’s price has yet to bottom for this bear market have a primary aim of sending ETH’s price back below the $1,044 level. If they achieve that aim, bearish Ether market participants then will take aim at ETH’s multi-year low of $883.62.
If they’re successful in making a new low on ETH for this bear market, their ultimate goal will be a 90% plus reset on Ether’s price as that would match the historical trend for the asset’s price in bear markets. A reset on ETH of that size would send the asset’s price below the $500 level again for the first time since November of 2020.

Ether’s Moving Averages: 5-Day [$1,255.45], 20-Day [$1,222.34], 50-Day [$1,320.00], 100-Day [$1,457.38], 200-Day [$1,817.96], Year to Date [$2,027.90].
ETH’s 24 hour price range is $1,240.03-$1,278.9 and its 7 day price range is $1,225.02-$1,288.22. Ether’s 52 week price range is $883.62-$4,148.85.
The price of ETH on this date in 2021 was $3,780.13.
The average price of ETH for the last 30 days is $1,229.19 and its -3.64% during the same stretch.
Ether’s price [+0.92%] closed its daily candle worth $1,274.98 on Monday.
Polkadot Analysis
Polkadot’s price was the worst performer of today’s lot but also finished in green digits and was +$0.011 on Monday.
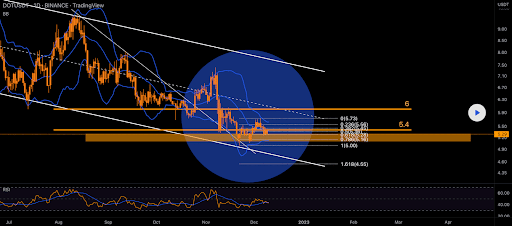
We’re wrapping up our price analyses today with the DOT/USDT 1D chart via MonoCoinSignal. DOT’s price is trading between the 1 fibonacci level [$5.00] and 0.786 [$5.16].
The targets for those longing DOT are as follows, 0.786, 0.618 [$5.28], 0.5 [$5.36], 0.382 [$5.45], 0.236 [$5.56], and the 0 fib level [$5.73].
Contrariwise, the levels of importance for bearish traders are the 1 fib level and the 1.618 [$4.55].

Polkadot’s Moving Averages: 5-Day [$5.31], 20-Day [$5.41], 50-Day [$5.92], 100-Day [$6.71], 200-Day [$9.81], Year to Date [$11.88].
Polkadot’s 24 hour price range is $5.15-$5.18 and its 7 day price range is $5.05-$5.51 DOT’s 52 week price range is $4.99-$32.76.
Polkadot’s price on this date last year was $25.99.
The average price of DOT over the last 30 days is $5.45 and its -14.29% over the same interval.
Polkadot’s price [+0.20%] closed its daily session on Monday worth $5.17 and bulls avoided a fourth consecutive day of bearish control.


