Bitcoin Analysis
Bitcoin’s price closed Tuesday’s daily session in green figures for the seventh time over the last ten days and +$257.
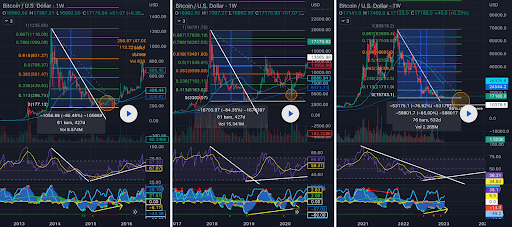
Today we’re looking back at Bitcoin’s previous two bear markets on the weekly time frame and Bitcoin’s price now relative to the BTC/USD 1W chart below from Roral. BTC’s price is trading between the 0 fibonacci level [$15,743.1] and the 0.113 [$21,751.9], at the time of writing.
Traders will note from the two previous bear markets that once the bottom was made on BTC there were months of consolidation and accumulation from bullish traders.
For bullish market participants to signal the bottom’s potentially in, they want to regain the 0.113 fib level followed by 0.236 [$28,292.5], 0.382 [$36,056.0], 0.5 [$42,330.7], and the 0.618 fib level [$48,605.3].
The bearish perspective is much different and bearish traders are still in control of the larger trend until bullish BTC market participants regain Bitcoin’s previous cycle high of $19,891. They’ve a primary target to the downside of the 0 fibonacci level. If they can push BTC’s price below that mark then there will be a new multi-year low on BTC and further downside becomes statistically more probable.

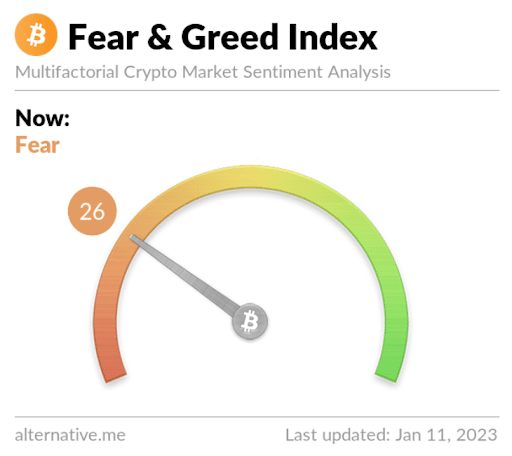
The Fear and Greed Index is 26 Fear and is equal to Tuesday’s reading.

Bitcoin’s Moving Averages: 5-Day [$16,997.07], 20-Day [$16,922.89], 50-Day [$17,211.63], 100-Day [$18,532.56], 200-Day [$23,412.14], Year to Date [$16,912.99].
BTC’s 24 hour price range is $17,155-$17,506 and its 7 day price range is $16,689-$17,506. Bitcoin’s 52 week price range is $15,505-$48,162.9.
The price of Bitcoin on this date last year was $42,725.
The average price of BTC for the last 30 days is $16,914.5 and its +0.5% over the same period.
Bitcoin’s price [+1.50%] closed its daily candle worth $17,445 and in positive figures for the third consecutive day on Tuesday.
Ethereum Analysis
Ether’s price has marked-up 5.54% over the last three days and when traders settled-up on Tuesday, ETH’s price was +$14.65.
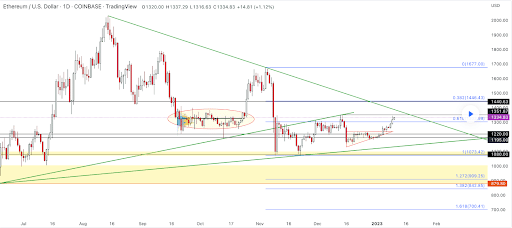
The ETH/USD 1D chart below by DannyC914 is the next chart we’re analyzing for this Wednesday. At the time of writing, ETH’s price is tucked between the 0.618 fibonacci level [$1,303.99] and the 0.382 fib level [$1,446.43].
The next significant level for bulls to reclaim is ETH’s 2018 all-time high and the 0.382 fib level [$1,446.43]. Above the 0.382 fibonacci level the secondary target for bulls of the Ether market is a full retracement to where the pattern broke down last time at the 0 fib level [$1,677.00].
Bearish ETH traders are attempting to pivot before or at the 0.382 fib level before attempting to push ETH’s price below the 0.618 fib level [$1,303.99]. The second target for those shorting ETH is the 1 fib level [$1,073.42]. If they have success in breaking the 1 fib level to the downside their focus shifts to 1.272 [$909.25], 1.382 [$842.45], and the 1.618 fibonacci level [$700.41].

Ether’s Moving Averages: 5-Day [$1,282.50], 20-Day [$1,238.19], 50-Day [$1,266.90], 100-Day [$1,359.11], 200-Day [$1,643.22], Year to Date [$1,263.30].
ETH’s 24 hour price range is $1,316.8-$1,347.69 and its 7 day price range is $1,214.55-$1,347.69. Ether’s 52 week price range is $883.62-$3,579.96.
The price of ETH on this date last year was $3,237.93.
The average price of ETH for the last 30 days is $1,236.77 and its +4.30% for the same duration.
Ether’s price [+1.11%] closed its daily candle on Tuesday worth $1,335.14 and in positive figures for a third day in a row.
Gala Analysis
GALA’s price has climbed higher for ten of the last twelve days and marked-up +$0.00101 on Tuesday.
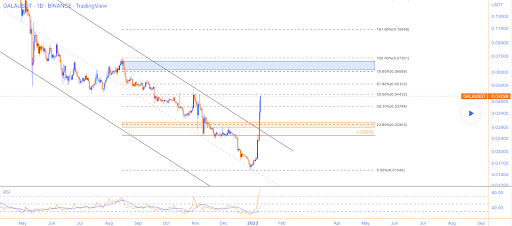
The GALA/USD 1D chart via MonoCoinSignal shows GALA’s price trading between the 38.20% fibonacci level [$0.03744] and 50.00% [$0.04423], at the time of writing.
As we can see below, over the last few days bullish GALA traders broke the upper ceiling of a long-term descending channel. Since, bullish traders have bumped up against the 50.00% fibonacci level and closed just below that mark when Tuesday’s candle was painted. Above the 50.00% fib level bulls have targets of 61.80% [$0.05102], 78.60% [$0.0609], 100.00% [$0.07301], and 161.80% [$0.10858].
Targets for bears of the GALA market are the 38.20% fib level, 23.60% [$0.02903], and a full retracement at the 0 fibonacci level [$0.01545].

GALA’s 24 hour price range is $0.04-$0.046 and its 7 day price range is $0.0176-$0.046. GALA’s 52 week price range is $0.0155-$0.394.
GALA’s price on this date in 2022 was $0.32.
The average price of GALA over the last 30 days is $0.021 and its +61.36% during the same duration.
GALA’s price [+2.49%] closed at $0.0416 when its daily candle was printed on Tuesday.


