Bitcoin Analysis
Bitcoin’s price closed $503.4 higher than it opened on Wednesday and in positive figures for a fourth consecutive daily session.
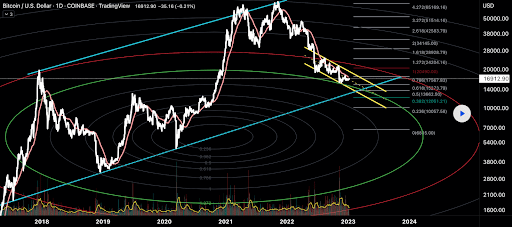
The BTC/USD 1D chart via Emvo10 is the first chart we’re looking at for this Thursday. BTC’s price is trading between the 0.786 fibonacci level [$17,567.83] and 1 [$20,490.00], at the time of writing.
The targets to the upside on Bitcoin are the 1.272 fib level [$24,204.16], and the 1.618 fib level [$28,928.79].
The first target to the downside for bears is the 0.786 fib level. The secondary target is the 0.618 fib level [$15,273.79] followed by 0.5 [$13,662.50], 0.382 [$12,051.21], 0.236 [$10,057.58], and a full retracement at 0 [$6,885.00] on ETH.

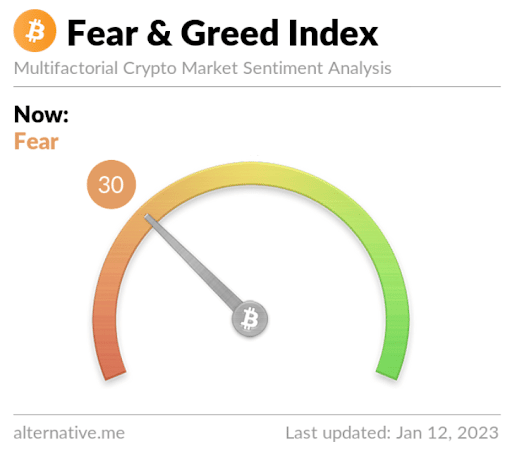
The Fear and Greed Index is 30 Fear and is +4 from Wednesday’s reading of 26 Fear.

Bitcoin’s Moving Averages: 5-Day [$17,166.65], 20-Day [$16,918.05], 50-Day [$17,155.42], 100-Day [$18,494.47], 200-Day [$23,271.38], Year to Date [$17,007.48].
BTC’s 24 hour price range is $17,316-$18,000 and its 7 day price range is $17,316-$18,000. Bitcoin’s 52 week price range is $15,505-$48,162.9.
The price of Bitcoin on this date last year was $43,888.9.
The average price of BTC for the last 30 days is $16,927.1 and its +1.6% over the same timespan.
Bitcoin’s price [+2.89%] closed its daily candle worth $17,942.1 and in green figures for the ninth time over the last eleven days.
Ethereum value Analysis
Ether’s price also is approaching critical levels after bulls put in their fourth straight green candle on Wednesday and Ether finished +$54.7.
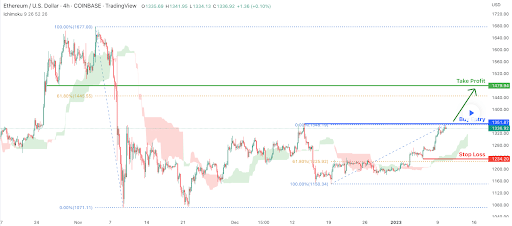
We’re shifting secondly to the ETH/USD 4HR chart below by desmondlzw. At the time of writing, ETH’s price is trading above the 0.00% fib level [$1,348.19].
The chartist posits that they’ll take profit at the $1,479.94 level if bullish traders can hold the 0.00% fib level. Bullish Ether market participants will be seeking candle close confirmation above that level again on Thursday before taking aim at ETH’s 2018 all-time high of $1,448.
Bearish Ether market participants have other motivations and want to push ETH’s price again below the 0.00% fib level followed by the 61.80% fib level [$1,225.92] and a third target of 100.00% [$1,150.34].

Ether’s Moving Averages: 5-Day [$1,301.51], 20-Day [$1,239.57], 50-Day [$1,262.33], 100-Day [$1,356.11], 200-Day [$1,632.76], Year to Date [$1,273.82].
Ether’s price is +5.47% against The U.S. Dollar for the last 90 days and +15.57% against BTC over the same period.
ETH’s 24 hour price range is $1,321.04-$1,398 and its 7 day price range is $1,256.91-$1,398. Ether’s 52 week price range is $883.62-$3,579.96.
The price of ETH on this date in 2022 was $3,370.48.
The average price of ETH for the last 30 days is $1,238.85 and its +5.45% for the same stretch.
Ether’s price [+4.10%] closed its daily session on Wednesday worth $1,389.84.
Shiba Inu Analysis
Shiba Inu’s price was the odd project out on Wednesday and concluded its trading session -$0.00000013.
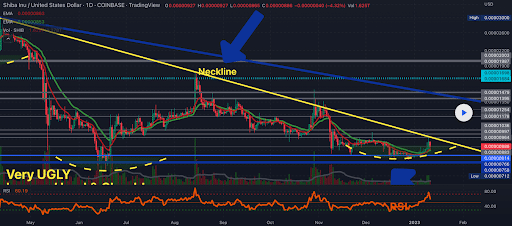
The SHIB/USD 1D chart below from ROYAL_OAK_INC shows bullish traders trying to crack the neckline of a large pattern and long-term downtrend.
The level that bulls need to regain to crack the neckline is $0.00000979.

SHIB’s Moving Averages: 5-Day [$0.000009], 20-Day [$0.000008], 50-Day [$0.000009], 100-Day [$0.000010], 200-Day [$0.000012], Year to Date [$0.000009].
Shiba Inu’s 24 hour price range is $0.00000865-0.0000093 and its 7 day price range is $0.00000865-$0.0000093. SHIB’s 52 week price range is 0.00000716-0.00003518.
Shiba Inu’s price on this date last year was $0.00003147.
The average price of SHIB over the last 30 days is $0.00000847 and its -3.25% for the same span.
Shiba Inu’s price [-1.40%] closed its daily candle worth $0.00000913 and in red digits for the first time in four days on Wednesday.


