Bitcoin Analysis
Bitcoin’s price made its highest high of the entire rally and its highest price since November 5th of last year on Monday. It was also the eighth time in the last nine days that BTC’s price marked-up and when traders settled-up for the day, BTC’s price was +$304.5.
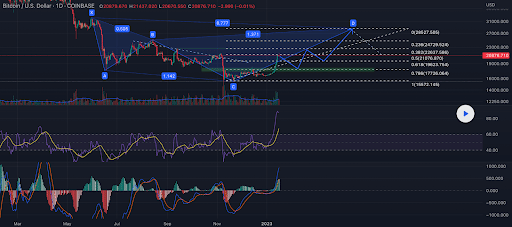
We’re leading-off this Tuesday’s price analyses with the BTC/USD 1D chart below by Lokendrakumar. BTC’s price is trading between the 0.5 fibonacci level [$21,076.87] and the 0.382 fib level [$22,637.58], at the time of writing.
The targets above the 0.382 for those longing BTC are 0.236 [$24,729.52], and a full retracement at the 0 fib level [$28,527.50].
Conversely, bearish BTC traders have targets to the downside on the daily timescale of 0.5, 0.618 [$19,623.75], 0.786 [$17,726.06], and the 1 fibonacci level [$15,572.14].

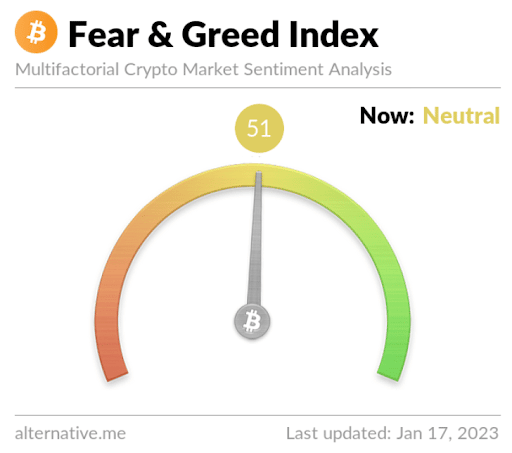
The Fear and Greed Index is 51 Neutral and is +6 from Monday’s reading of 45 Fear.

Bitcoin’s Moving Averages: 5-Day [$18,900.49], 20-Day [$17,296.19], 50-Day [$17,116.58], 100-Day [$18,450.74], 200-Day [$22,918.21], Year to Date [$17,789.10].
BTC’s 24 hour price range is $20,511-$21,469 and its 7 day price range is $17,188-$21,469. Bitcoin’s 52 week price range is $15,505-$48,162.9.
The price of Bitcoin on this date last year was $42,205.2.
The average price of BTC for the last 30 days is $17,381.1 and its +17.1% over the same interval.
Bitcoin’s price [+1.46%] closed its daily candle worth $21,183.6 and made its highest daily candle close of the recent rally by bulls on Monday.
Ethereum Analysis
Ether’s price followed BTC’s lead higher on Monday and concluded its daily trading session +$24.24.
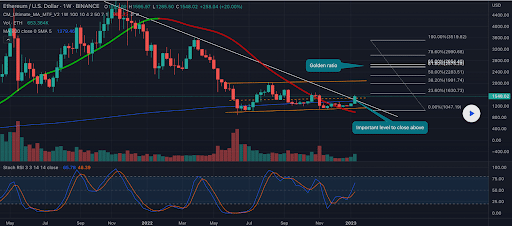
The ETH/USD 1W chart via EdgarTigranyan is the second chart we’re analyzing for this Tuesday. At the time of writing, ETH’s price is trading between the 0.00% fib level [$1,047.19] and 23.60% [$1,630.73].
Above the 23.60% fib level bullish traders of Ether have targets of 38.20% [$1,991.74], 50.00% [$2,283.51], 61.80% [$2,654.40], 78.60% [$2,990.68], and the 100.00% fibonacci level [$3,519.82].
From the perspective of bearish ETH traders, their primary aim is to push ETH’s price below the 0.00% fib level with the $1k level as a secondary aim. Below the $1k level bearish Ether traders have a third target of ETH’s multi-year low of $883.62.

Ether’s Moving Averages: 5-Day [$1,420.62], 20-Day [$1,272.65], 50-Day [$1,256.99], 100-Day [$1,350.94], 200-Day [$1,606.30], Year to Date [$1,329.33].
ETH’s 24 hour price range is $1,521.31-$1,604.5 and its 7 day price range is $1,320.49-$1,604.5. Ether’s 52 week price range is $883.62-$3,579.96.
The price of ETH on this date in 2022 was $3,209.25.
The average price of ETH for the last 30 days is $1,273.47 and its +18.38% over the same period.
Ether’s price [+1.56%] closed its daily session on Monday worth $1,576.93 and in green figures for a ninth day in a row.
Litecoin Analysis
Litecoin’s price was pushed lower by sellers yesterday and LTC finished the day -$1.49.
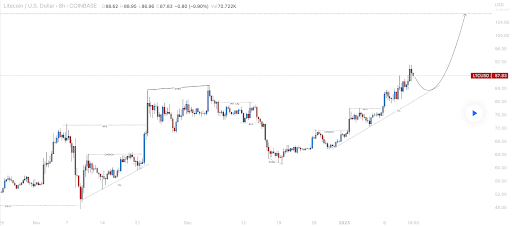
The LTC/USD 8HR chart from Setupsfx_ shows that LTC’s price clearly began its uptrend before the majority of the cryptocurrency field.
If bullish Litecoin traders can exceed the $90 level their primary target is the $107 level on the 8HR timescale.
The current uptrend on Litecoin’s 8HR chart dates back to mid-December 2022 and bullish market participants are hoping it’s an indication of things to come for the aggregate cryptocurrency market.

Litecoin’s Moving Averages: 5-Day [$84.47], 20-Day [$73.64], 50-Day [$71.31], 100-Day [$63.26], 200-Day [$65.63], Year to Date [$79.90].
Litecoin’s 24 hour price range is $83.91-$89.16 and its 7 day price range is $80.83-$89.42. LTC’s 52 week price range is $40.4-$153.5.
Litecoin’s price on this date last year was $151.10.
The average price of LTC over the last 30 days is $73.4 and its +15.63% during the same period.
Litecoin’s price [-1.70%] closed its daily candle worth $85.91 during Monday’s trading session and in negative digits for a second straight day.


