
Bitcoin Analysis
Bitcoin’s price finished the weekly time frame again in green digits but pulled back on the daily timescale on Sunday and finished the day’s trading session -$53.
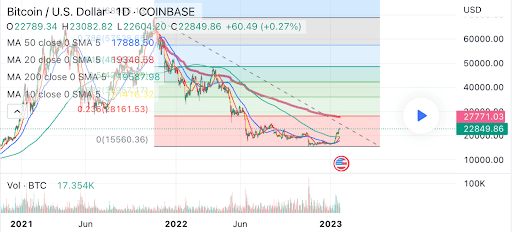
The BTC/USD 1D chart by sanjarnaderi is the first chart we’re analyzing for this Monday. BTC’s price is trading between the 0 fibonacci level [$15,560.36] and the 0.236 fib level [$28,161.53], at the time of writing.
The overhead targets for those that are longing BTC are 0.236, 0.382 [$35,957.17], and the 0.5 fib level [$42,257.75] over the interim.
Bearish BTC traders want to again send BTC’s price below the $20k level with a secondary aim of a full retracement from BTC’s multi-year low at the 0 fib level.
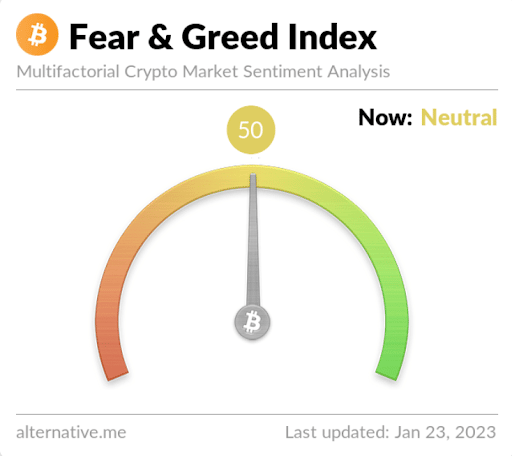
The Fear and Greed Index is 50 Neutral and is -3 from Sunday’s reading of 53 Neutral.
Bitcoin’s Moving Averages: 5-Day [$21,299.24], 20-Day [$18,227.32], 50-Day [$17,371.69], 100-Day [$18,503.21], 200-Day [$22,543.86], Year to Date [$18,756.60].
BTC’s 24 hour price range is $22,310-$23,072 and its 7 day price range is $20,678-$23,072. Bitcoin’s 52 week price range is $15,505-$48,162.9.
The price of Bitcoin on this date last year was $36,255.1.
The average price of BTC for the last 30 days is $18,313.2 and its +35.6% over the same interval.
Bitcoin’s price [-0.23%] closed its daily candle worth $22,713 on Sunday and in red digits for the first time in four days.
Ethereum Analysis
Ether’s price outperformed Bitcoin on Sunday and when traders settled-up for the day, ETH’s price was +$1.52.
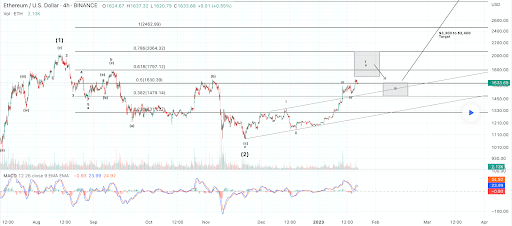
The second chart we’re looking at today is the ETH/USD 4HR chart via maikisch. At the time of writing, Ether’s price is trading between the 0.5 fibonacci level [$1,630.39] and the 0.618 fib level [$1,797.12].
On the 4HR time frame bullish Ether traders have targets above of 0.618, 0.786 [$2,064.32] and the 1 fib level [$2,462.99].
Conversely, the targets to the downside are 0.5, 0.382 [$1,479.14] and the 0.236 fibonacci level [$1,311.27].
Ether’s Moving Averages: 5-Day [$1,574.31], 20-Day [$1,348.30], 50-Day [$1,276.80], 100-Day [$1,351.67], 200-Day [$1,577.45], Year to Date [$1,396.94].
ETH’s 24 hour price range is $1,604-$1,663.89 and its 7 day price range is $1,511.24-$1,663.89. Ether’s 52 week price range is $883.62-$3,579.96.
The price of ETH on this date in 2022 was $2,540.45.
The average price of ETH for the last 30 days is $1,346.56 and its +36.19% for the same interval.
Ether’s price [+0.09%] closed its daily session on Sunday in green figures for the third time in four days and worth $1,627.01.
Crypto: Aptos Analysis
The price of Aptos marked up again on Sunday and when the day’s trading session wrapped-up, APT was +$1.56.
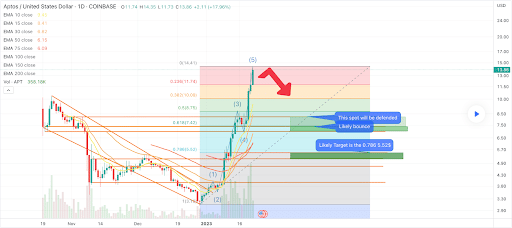
The final chart we’re analyzing for today is the APTOS/USD 1D chart below from ChartPatternExpress. APTOS is trading between the 0.236 fibonacci level [$11.74] and the 0 fib level [$14.41], at the time of writing.
The chartist is positing a potential pullback for APTOS if bullish traders don’t regain the 0 fib level and leave it behind.
Meanwhile, bearish traders are aiming for precisely such a retracement with a primary aim of the 0.236. The secondary aim of bearish traders is the 0.382 [$10.09] followed by fib targets of 0.5 [$8.75] and the 0.618 fib level [$7.42].
APTOS is +73.1% against The U.S. Dollar over the last 7 days, +57.82% against BTC, and +62.21% against ETH over the same period.
Aptos [+13.27%] closed its daily candle worth $13.31 on Sunday and in green digits for the fourth consecutive day.