
Key Insights
- Volumes on Uniswap dropped 17% in Q4, despite being cushioned by volatility surrounding the November FTX collapse.
- A study of closed positions in the USDC/ETH 5bps pool revealed that 55% of positions outperformed holding in both USDC and ETH terms, while 40.3% of positions resulted in a loss in both terms.
- Just-in-time liquidity provisions increased by 197% in Q4.
- Uniswap launched an NFT Aggregator and integrated a fiat on-ramp in Q4.
- In Q4, margins remained steady around 0.13%, maintaining Q3 levels, as volumes are dominated by stable pools.
Primer on Uniswap
Uniswap is an automated market making protocol that facilitates the trading of tokens on the Ethereum network and on its scaling solutions, namely Optimism, Arbitrum, and Polygon. The protocol is recognized as a pioneer among decentralized exchanges (DEXs) for its popularization of the X*Y=K constant product pricing curve of pooled liquidity in V2 and, subsequently, for its concentrated liquidity and staggered trading fee features in V3. Many competing DEXs have since implemented the constant product pricing curve. Nonetheless, the concentrated liquidity model and fee tiers remain relatively unique to Uniswap.
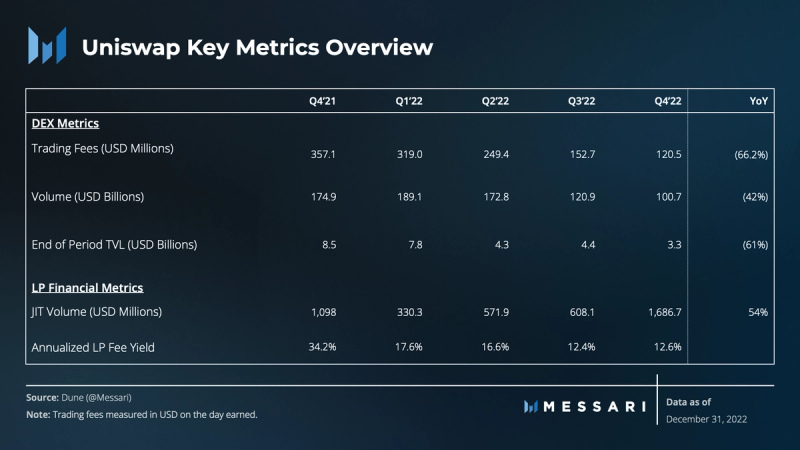
Key Metrics
Performance Analysis
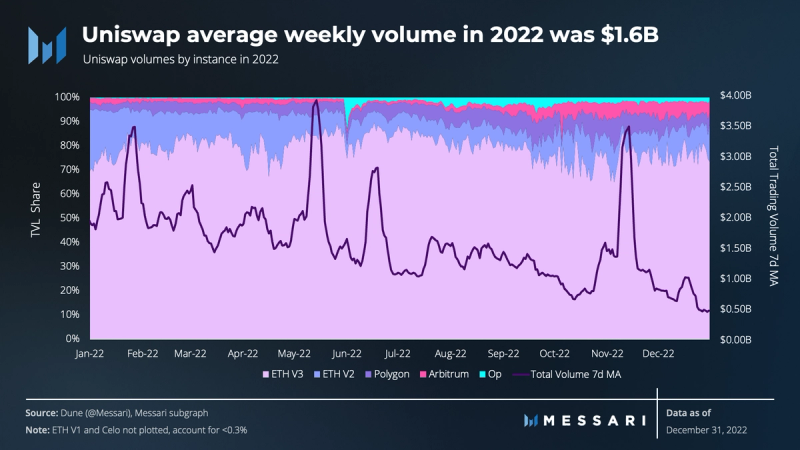
Total volume dropped 17% QoQ, despite being cushioned by volatility surrounding the November FTX collapse. Four days of increased activity followed the collapse and represented 19% of the volume for the quarter. Additionally, Uniswap’s DEX experienced a QoQ decrease in its volume market share, from 67.7% in Q3 to 64.3% in Q4. Uniswap held a 67.2% volume share in Q1.
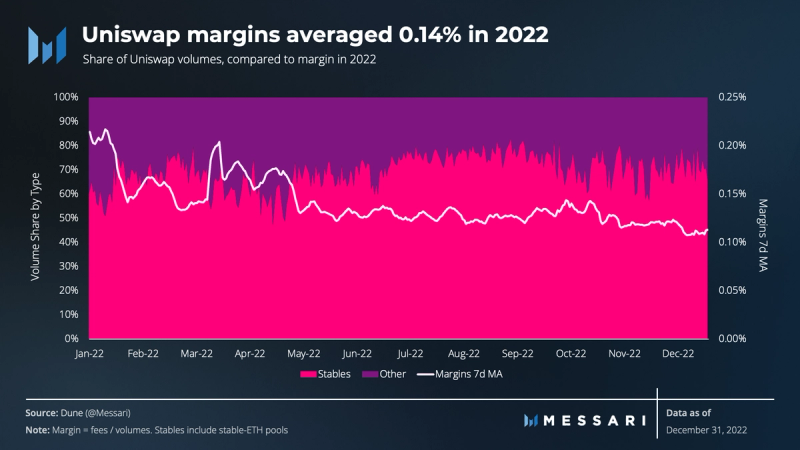
In Q4, margins, as measured by the amount of fees paid per unit of volume traded, remained steady at 0.13% but dropped 0.07% YoY. The decline from Q4’21 is primarily driven by the increased dominance of volume from stablecoin pools, which typically charge lower fees (0.01% or 0.05%) than non-stable pools (0.05% – 1%). This trend of stable pools dominating the trading volume is not exclusive to Uniswap, and it is likely driven by the increasing market share of stablecoins, as the prices of other assets have significantly fallen.
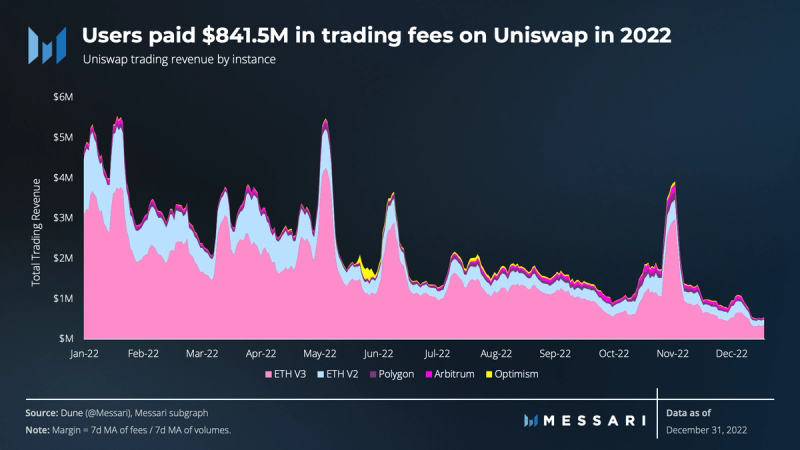
In Q4, liquidity providers (LPs) earned $1.3 million in trading fees on average per day, representing a 63% drop from the $3.5 million earned on average per day in Q1. Of the trading fees generated, 71% came from the V3 instance on Ethereum, 7% from EVM-scaling solutions, and 22% from Ethereum v2.
Among EVM-scaling solutions, the Arbitrum instance generated the most fees despite 16% less on average liquidity than the Polygon instance. This outperformance on Arbitrum can be attributed to the fact that it does not yet have a 1 bps fee tier, unlike the Polygon and Optimism instances, making Abritrum more profitable at lower trading volumes. Additionally, one of the most traded pairs on Arbitrum is ETH/GMX, which has 30 bps and 100 bps pools. These pools only represented 10% of the trading volume in 2022, but generated 43% of the fees.
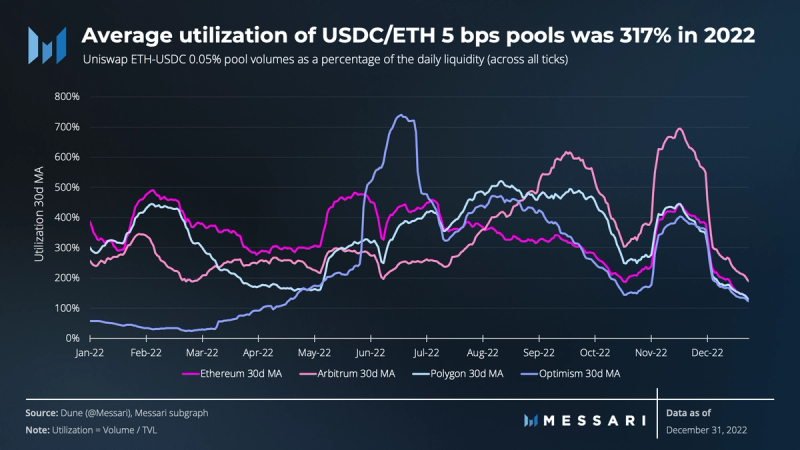
USDC/ETH pools are major contributors to the platform’s overall trading volume and revenue. In 2022, these pools accounted for 50% of Uniswap’s volumes and 29% of trading revenue. Among these pools, the 5 bps pool catches most of the action, accounting for 87% of USDC/ETH volume and 53% of revenue across the year.
The 5 bps USDC/ETH pool on Arbitrum exhibited the highest utilization rate in 2022, averaging 341%. After being the least utilized in Q2, the pool on Arbitrum experienced a significant growth in trading volume compared to the size of the pool. With the exception of Ethereum, which experienced a decline for the second straight quarter, all instances of the 5 bps pool saw an increase in utilization for the second consecutive quarter in Q4.
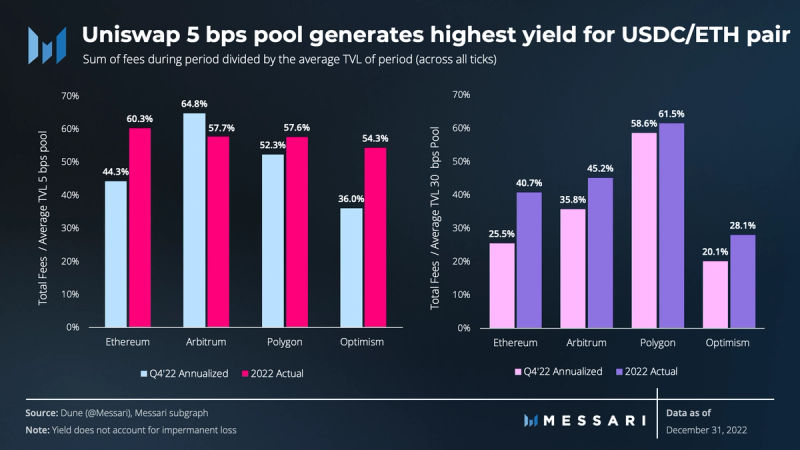
The introduction of concentrated liquidity in Uniswap V3 makes it difficult to generalize returns across V3 pools. In V3, liquidity providers (LPs) can provide liquidity to a specific range of prices, In V2, conversely, LPs were entitled to the same proportion of fees, regardless of the price range for which they provided liquidity. This means that the overall pool fee distribution is not proportional and varies depending on the price ranges (ticks) and amounts of liquidity provided by different LPs.
When disregarding the concept of impermanent loss and by using the V2 fee approach, the 5 bps pool on the Ethereum instance generated the highest yield as a percentage of the average daily liquidity in 2022. However, when annualizing Q4, the 5 bps pool on the Arbitrum instance produced the highest yield. This outperformance is a result of increased usage on Arbitrum and an increase in the percentage of Arbitrum users using Uniswap. The number of unique addresses on Arbitrum increased 76% in Q4, compared to a 56% increase on Optimism and an 18% increase on Polygon. Additionally, the percentage of active Arbitrum users transacting on Uniswap also increased in Q4 from 26% to 30%.
Just-In-Time Liquidity (JIT)
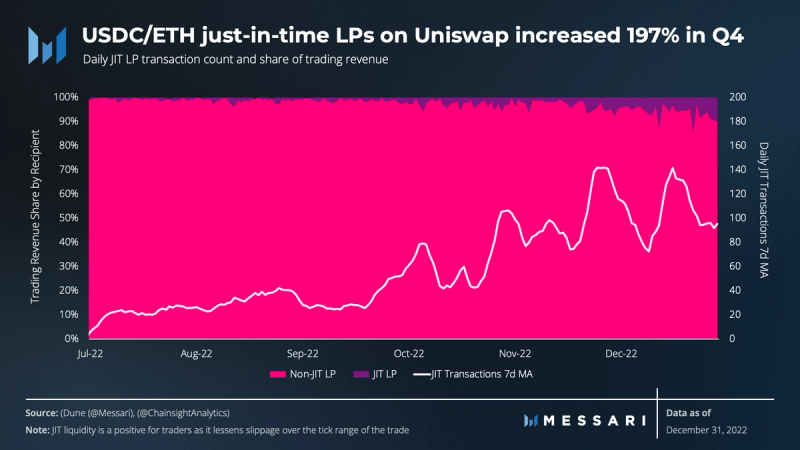
Just-In-Time (JIT) liquidity is a maximal extractable value (MEV) tactic used to instantaneously capture trading fees by providing liquidity, usually within one tick, to a pool before a large trade is confirmed. This allows the MEV searcher to gain a large cut of the trading fees only to subsequently pull that liquidity out in the same block. Although it is a rare form of MEV, with only 21,600 attempts as of year-end, the frequency of JIT liquidity rapidly increased in 2022, with each quarter having on average 2.6x more JIT transactions than the previous. As of year end, JIT liquidity received roughly $5 million in trading fees since the launch of Uniswap V3, with an estimated profit of $2.7 million after gas fees and miner bribes.
Since the inception of V3, one address drove the vast majority of JIT activity, accounting for 75% of the transactions and 85% of all revenue earned from JIT liquidity. Notably, 79% of the targeted trade volume came from the USDC/ETH 5 bps pool and 30 bps pool. As a result of the increased activity, the share of USDC/ETH trading fees going to JIT liquidity also increased, jumping from 0.9% in Q3 to 2.1% in Q4. In December alone, JIT liquidity received 5.8% of the fees between these pools. However, it is important to note that while JIT liquidity captures a portion of trading fees from targeted trades, 95% of the volume traded on Uniswap V3 and the resulting LP fees generated from that volume remained unaffected. In Q3, JIT liquidity serviced only 0.7% of the volume on Ethereum V3. That number jumped to 2.8% in Q4 and 7% over the last week of the year. Notably, JIT liquidity may siphon fees from less sophisticated participants, but it also serves as a positive for traders since it lessens slippage over the tick range of the trade.
LP Profitability
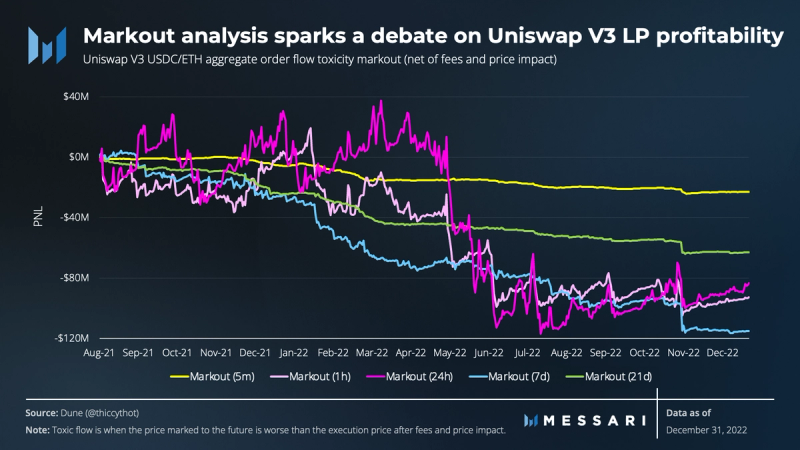
An ongoing debate in the DeFi Twitter space concerns the profitability of LPs on Uniswap V3. Specifically, for the most liquid tokens, price discovery occurs on centralized exchanges (CEXs) and then LPs on DEXs are constantly used to arbitrage the “fair price.” The debate is still unsettled, but some leading thoughts from the quarter were:
- The primary study that kicked off the debate was from @thiccythot_ of Friktion Labs who applied this markout methodology to an analysis of the ETH/USDC pair on Uniswap V3 and found the susceptibility of Uniswap V3 LPs to toxic order flow potentially cost LPs over $100 million. The Uniswap Labs team conducted their own analysis and claimed that, when accounting for fees, LPs were actually profitable in aggregate.
- @0xShitTrader found a flaw in the Uniswap Labs’ analysis, resulting in half of all trades being ignored, and when adjusted, his findings nearly mirrored those of @thiccythot_.
- @0xfbifemboy of Crocswap furthered the conversation with the analysis: Usage of Markout to Calculate LP Profitability in Uniswap V3. His findings suggested that if markout is a useful metric for AMM LPs, then using the price of the pool after the final swap as the markout price demonstrates a more accurate estimate of profitability. The article concluded that even when marking each swap to its final marginal price, the 0.05% tier is almost certainly underpricing liquidity and responsible for a majority of the losses accruing to LPs.
- Follow-Up Analysis of LP Profitability in Uniswap V3 by @0xfbifemboy moved on to compare the profitability of LPs on the Ethereum instance to those on Polygon. The findings demonstrated that Polygon LPs perform better, losing 10-20% less on average, due to faster block times and better price discovery. As a result, the study suggests that making prices respond faster to a fixed notional swap size and increasing the sensitivity of liquidity could change the net profitability of LPs without affecting the quality of liquidity for the average trader.
- Independent researcher @Charliemktplace joined the discussion by releasing an analysis that tracked the performance of LPs from the inception of V3 through September 2022. It took a different approach by comparing closed LP positions to simply holding the assets over the same period of time. It found that 55% of positions outperformed holding in both USDC and ETH terms, while 40.3% of positions resulted in a loss in both terms. Additionally, 31.6% of positions increased their value in USD terms only.
When reviewing @charliemktplace’s dataset, the total ETH gain of LP strategies over holding was -29,500 ETH, equal to a $67.9 million loss. However, this loss was skewed by a small number of major losers. The top 10 losers accounted for .04% of the unique positions but contributed 53% of ETH loss and 61% of the USD loss over holding. Uniswap research suggested that these major losers are likely delta neutral market makers with big gains on off-chain exchanges. However, this is unconfirmable. Of the 27,313 unique positions, the average gain was 0.7% and the median gain was 0.008%. Notably, these numbers only represent closed positions, many of which were likely cutting losses as the price of ETH dropped more than 70% during the period analyzed.
Given the profitability challenges faced by LPs, dynamic fees that respond to liquidity conditions have been one of the most discussed solutions. However, the implementation of such a solution would be difficult and perhaps unlikely in the near term for Uniswap.
Total Value Locked (TVL)
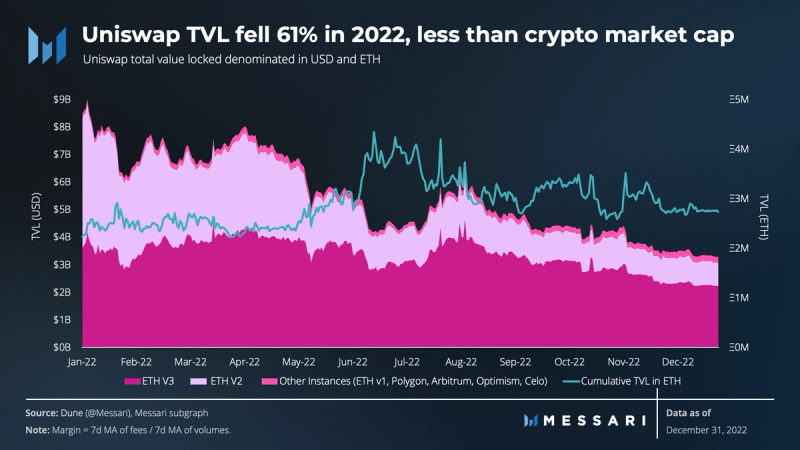
Despite the broader market declines driving down the USD value of TVL on Uniswap in 2022, the TVL measured in ETH terms actually increased. This suggests the token share of TVL has steadily increased. For comparison, TVL on Uniswap fell less than it did on competitors Sushiswap (-90%) and Curve (-84%), but not as little as it did on Balancer (-57%). In Q4, TVL increased on Uniswap’s V3 instances, with the exception of Ethereum and Optimism. The Ethereum and Optimism instances experienced a decrease of 30% and 42%, respectively. The greatest increase in TVL was seen on the Polygon instance at 47%, followed by Celo and Arbitrum at 15% and 39%, respectively.
Uniswap launches NFT Aggregator
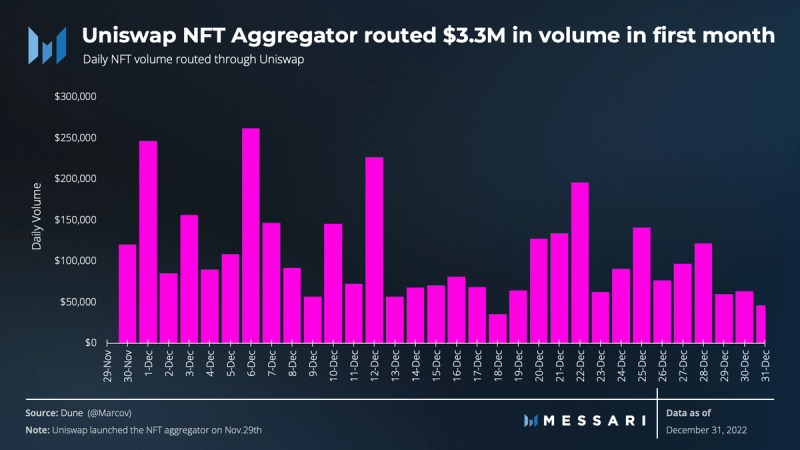
Building on top of the Genie acquisition, Uniswap Labs launched its NFT Aggregator in November, which allows users to trade on major marketplaces such as OpenSea, X2Y2, LooksRare, Sudoswap, etc. Additionally, $5 million USDC was airdropped to historical Genie users and gas rebates to the first 22,000 NFT purchasers. In the first month of being live, the aggregator routed $3.3 million of NFT volume. Specifically, 46% of the transactions were routed through OpenSea and 34% through LooksRare.
Qualitative Analysis
Flight to Transparency
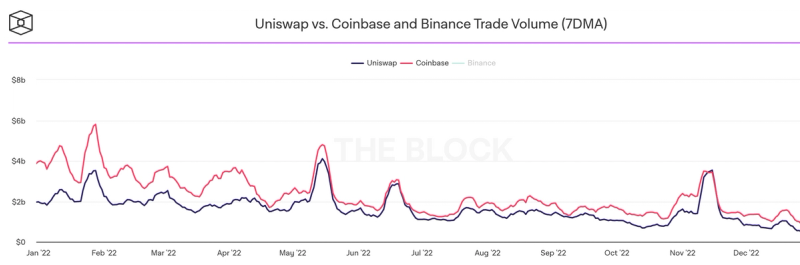
Source: The Block
According to a letter to investors from Bitwise, Uniswap is expected to trade more volume than Coinbase by Q4 2023. This prediction is not unexpected, as Uniswap has seen a significant increase in trading volume in recent months. Following the November collapse of FTX, Uniswap briefly surpassed Coinbase in terms of trading volume, positioning it right behind Binance for ETH volume settled.
Investors have been losing confidence in CEXs due to their lack of transparency and security. Uniswap, as the top DEX by volume, is in a unique position to capitalize on this trend and onboard a significant number of users to DeFi. The team at Uniswap is taking advantage of this opportunity by integrating new features that enhance the user experience and further solidify its position in the industry. One such example is the integration of Moonpay, a payment gateway enabling users to convert fiat to crypto directly on the platform without the need to go through a CEX.
Streamlining Governance Process
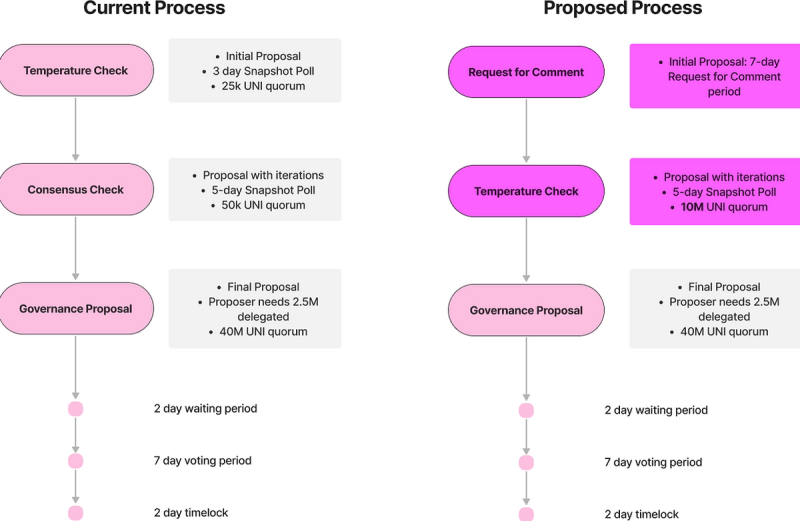
Source: Uniswap Governance
Internally, the Uniswap community made operational changes by voting to simplify the governance process. The first change replaced the initial Snapshot poll with a “Request for Comment” post. This allows for proposals to move quicker through the governance process. The second and most impactful change is the increase from 50,000 UNI to 10 million UNI (worth roughly $65 million as of January 16) needed to reach quorum for the remaining Snapshot poll. By raising the quorum, the barrier for clearing preliminary votes is drastically increased and likely to filter out low quality proposals. These changes, proposed by the Uniswap Foundation (UF) as part of their mission to reduce friction in the community governance process, were passed with a 100% approval rating.
Fee Switch Vote Delayed
In November, UF Grantee and advisory firm Alastor, provided the community with research concerning the qualitative and quantitative implications of a fee switch. The fee switch refers to redirecting a portion of the trading fee, currently paid to liquidity providers, to the UniswapDAO treasury as a protocol fee. Alastor’s research suggested that activating the fee switch can be a tool used to move liquidity into lower fee pools, increase platform efficiency, and grow both volumes and market share. Following the research from Alastor, a final on-chain vote was expected to begin on December 1. However, it was delayed again as members in the community expressed the need for further de-risking of potential regulatory issues before proceeding. Others argued that the proposal should move forward, recognizing that there will always be some level of uncertainty. Following two weeks of community discussion, Uniswap Foundation (UF) stated plans to put a legal entity in place to de-risk potential tax implications before moving on with the vote. They also suggested that an alternative approach, where fees are accrued to UNI token holders who opt in, could be explored as a way to avoid some of the risks.
Grants
UF awarded ~$946,000 across 19 grants in its second wave of funding, ending the year at $2.7 million awarded to 33 grantees. The grants are spread across four categories: Protocol Growth, Research and Development, Community Growth, and Governance Stewardship.
In the Protocol Growth category, a grant was awarded for liquidity pool provisioning on testnets. The independent grantee aims to create a plugin that automatically deploys and maintains liquidity pools on an Ethereum test environment, addressing a pain point for developers looking to test on, or simulate with, liquidity pools.
Another grant in this category is for xToken Terminal UniV3 LP Position Rebalancer, which aims to allow users to reposition their liquidity in one transaction rather than the current method of three separate transactions. The tool will guide users through selecting new liquidity ratios and automatically execute the necessary trades.
In the Research and Development category, there is a grant for Lanturn: MEV estimator research and prototype being led by Ari Juels, chief scientist at Chainlink Labs. This work aims to allow swappers to better predict whether MEV will occur, and to what extent they will be impacted, prior to executing a transaction on Uniswap. It will also help users reduce trading costs and developer tooling will be built to allow engineers to understand the impact of MEV on their users and to adjust smart contracts to reduce their exposure.
Closing Summary
Uniswap made strides in expanding its addressable market with the launch of an NFT aggregator and by integrating a fiat on-ramp into the web app, despite reduced trading volumes in Q4. The increase in JIT liquidity and continued discussions around LP profitability likely indicate users are becoming more sophisticated. The fee switch remains a hot topic in the forum, but voting remains delayed as there are many conflicting opinions and potential implications. Amidst the collapse of overleveraged CEXs in 2022, decentralized alternatives proved to be the better solution. Given Uniswap’s market-leading rank in this category, 2023 looks promising.


