
Presently, XRP’s price action is not looking overly promising against either USDT or BTC. Things could worsen in the coming days if all remains as it is right now.
Technical Analysis
By: Edris
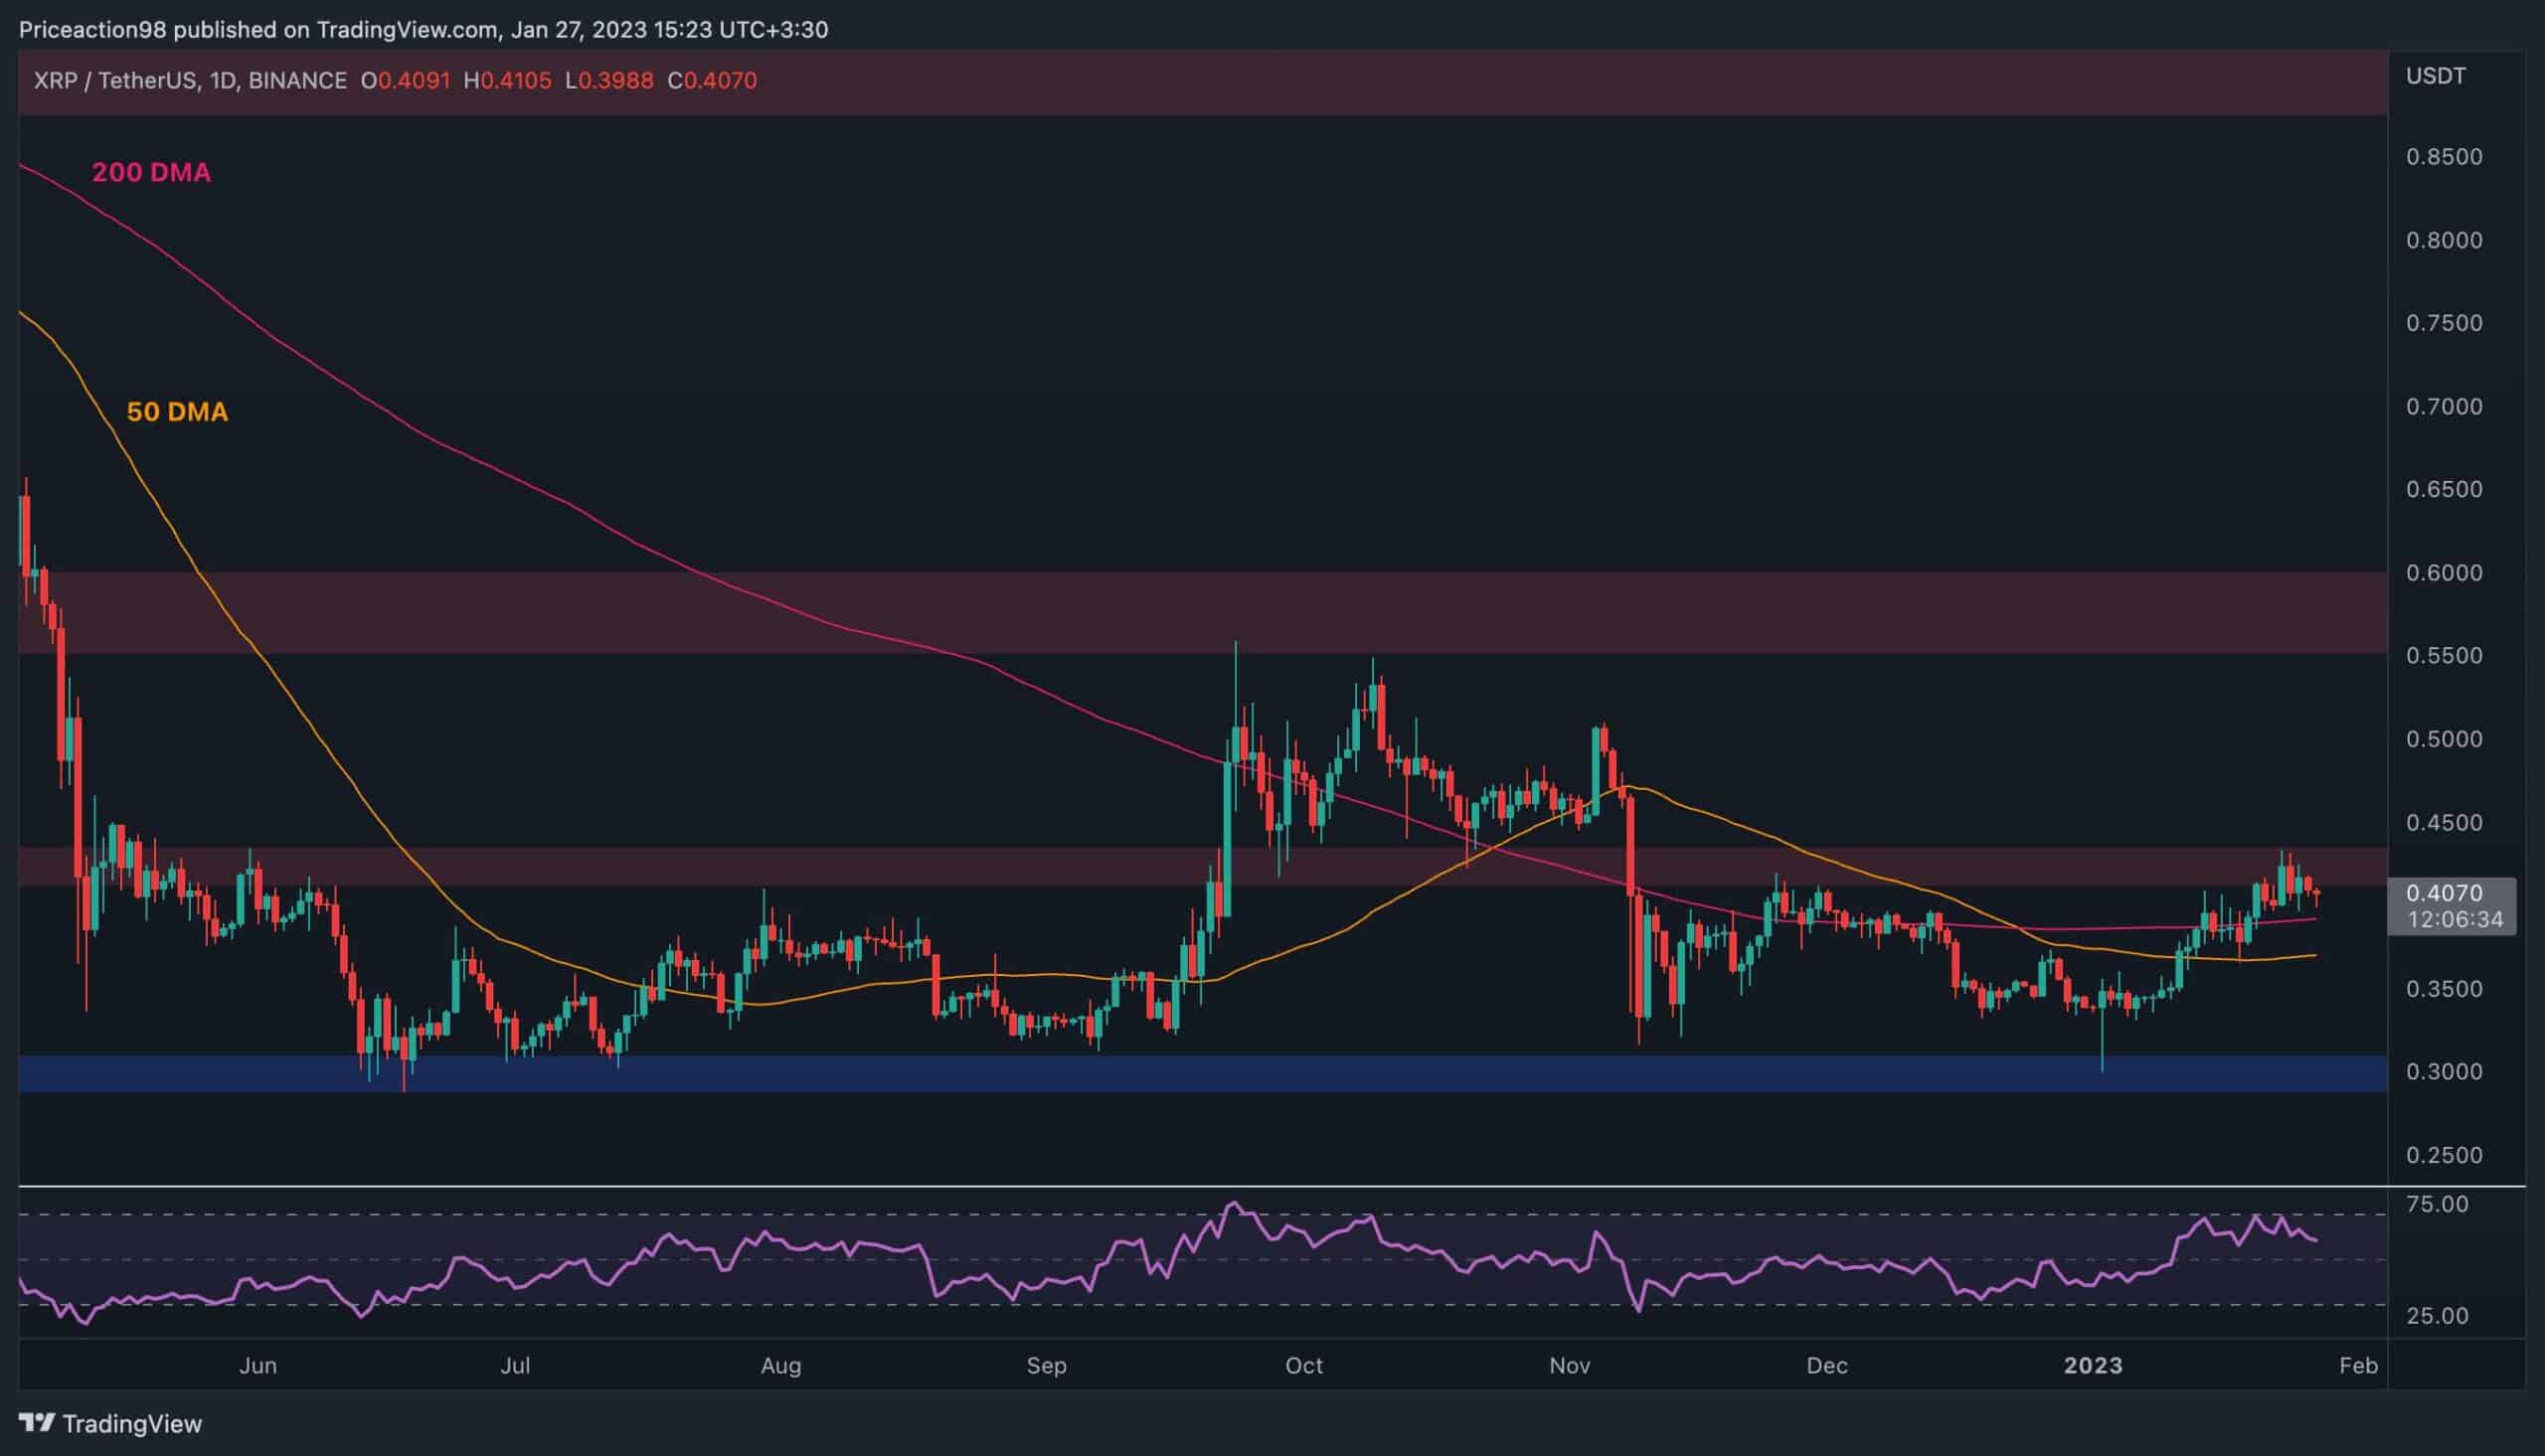
XRP/USDT Daily Chart
On the daily chart, the price continues its struggle to break above the $0.43 resistance level, following a push above both the 50-day and 200-day moving average lines.
In case the cryptocurrency finally moves beyond the aforementioned level, a rally toward the $0.55 resistance area could be expected. This scenario would likely lead to a new bullish phase in the short term.
On the contrary, a rejection from the $0.43 level would likely initiate a decline toward the 50-day moving average located around the $0.35 mark, and the $0.3 support level would even be highly probable.
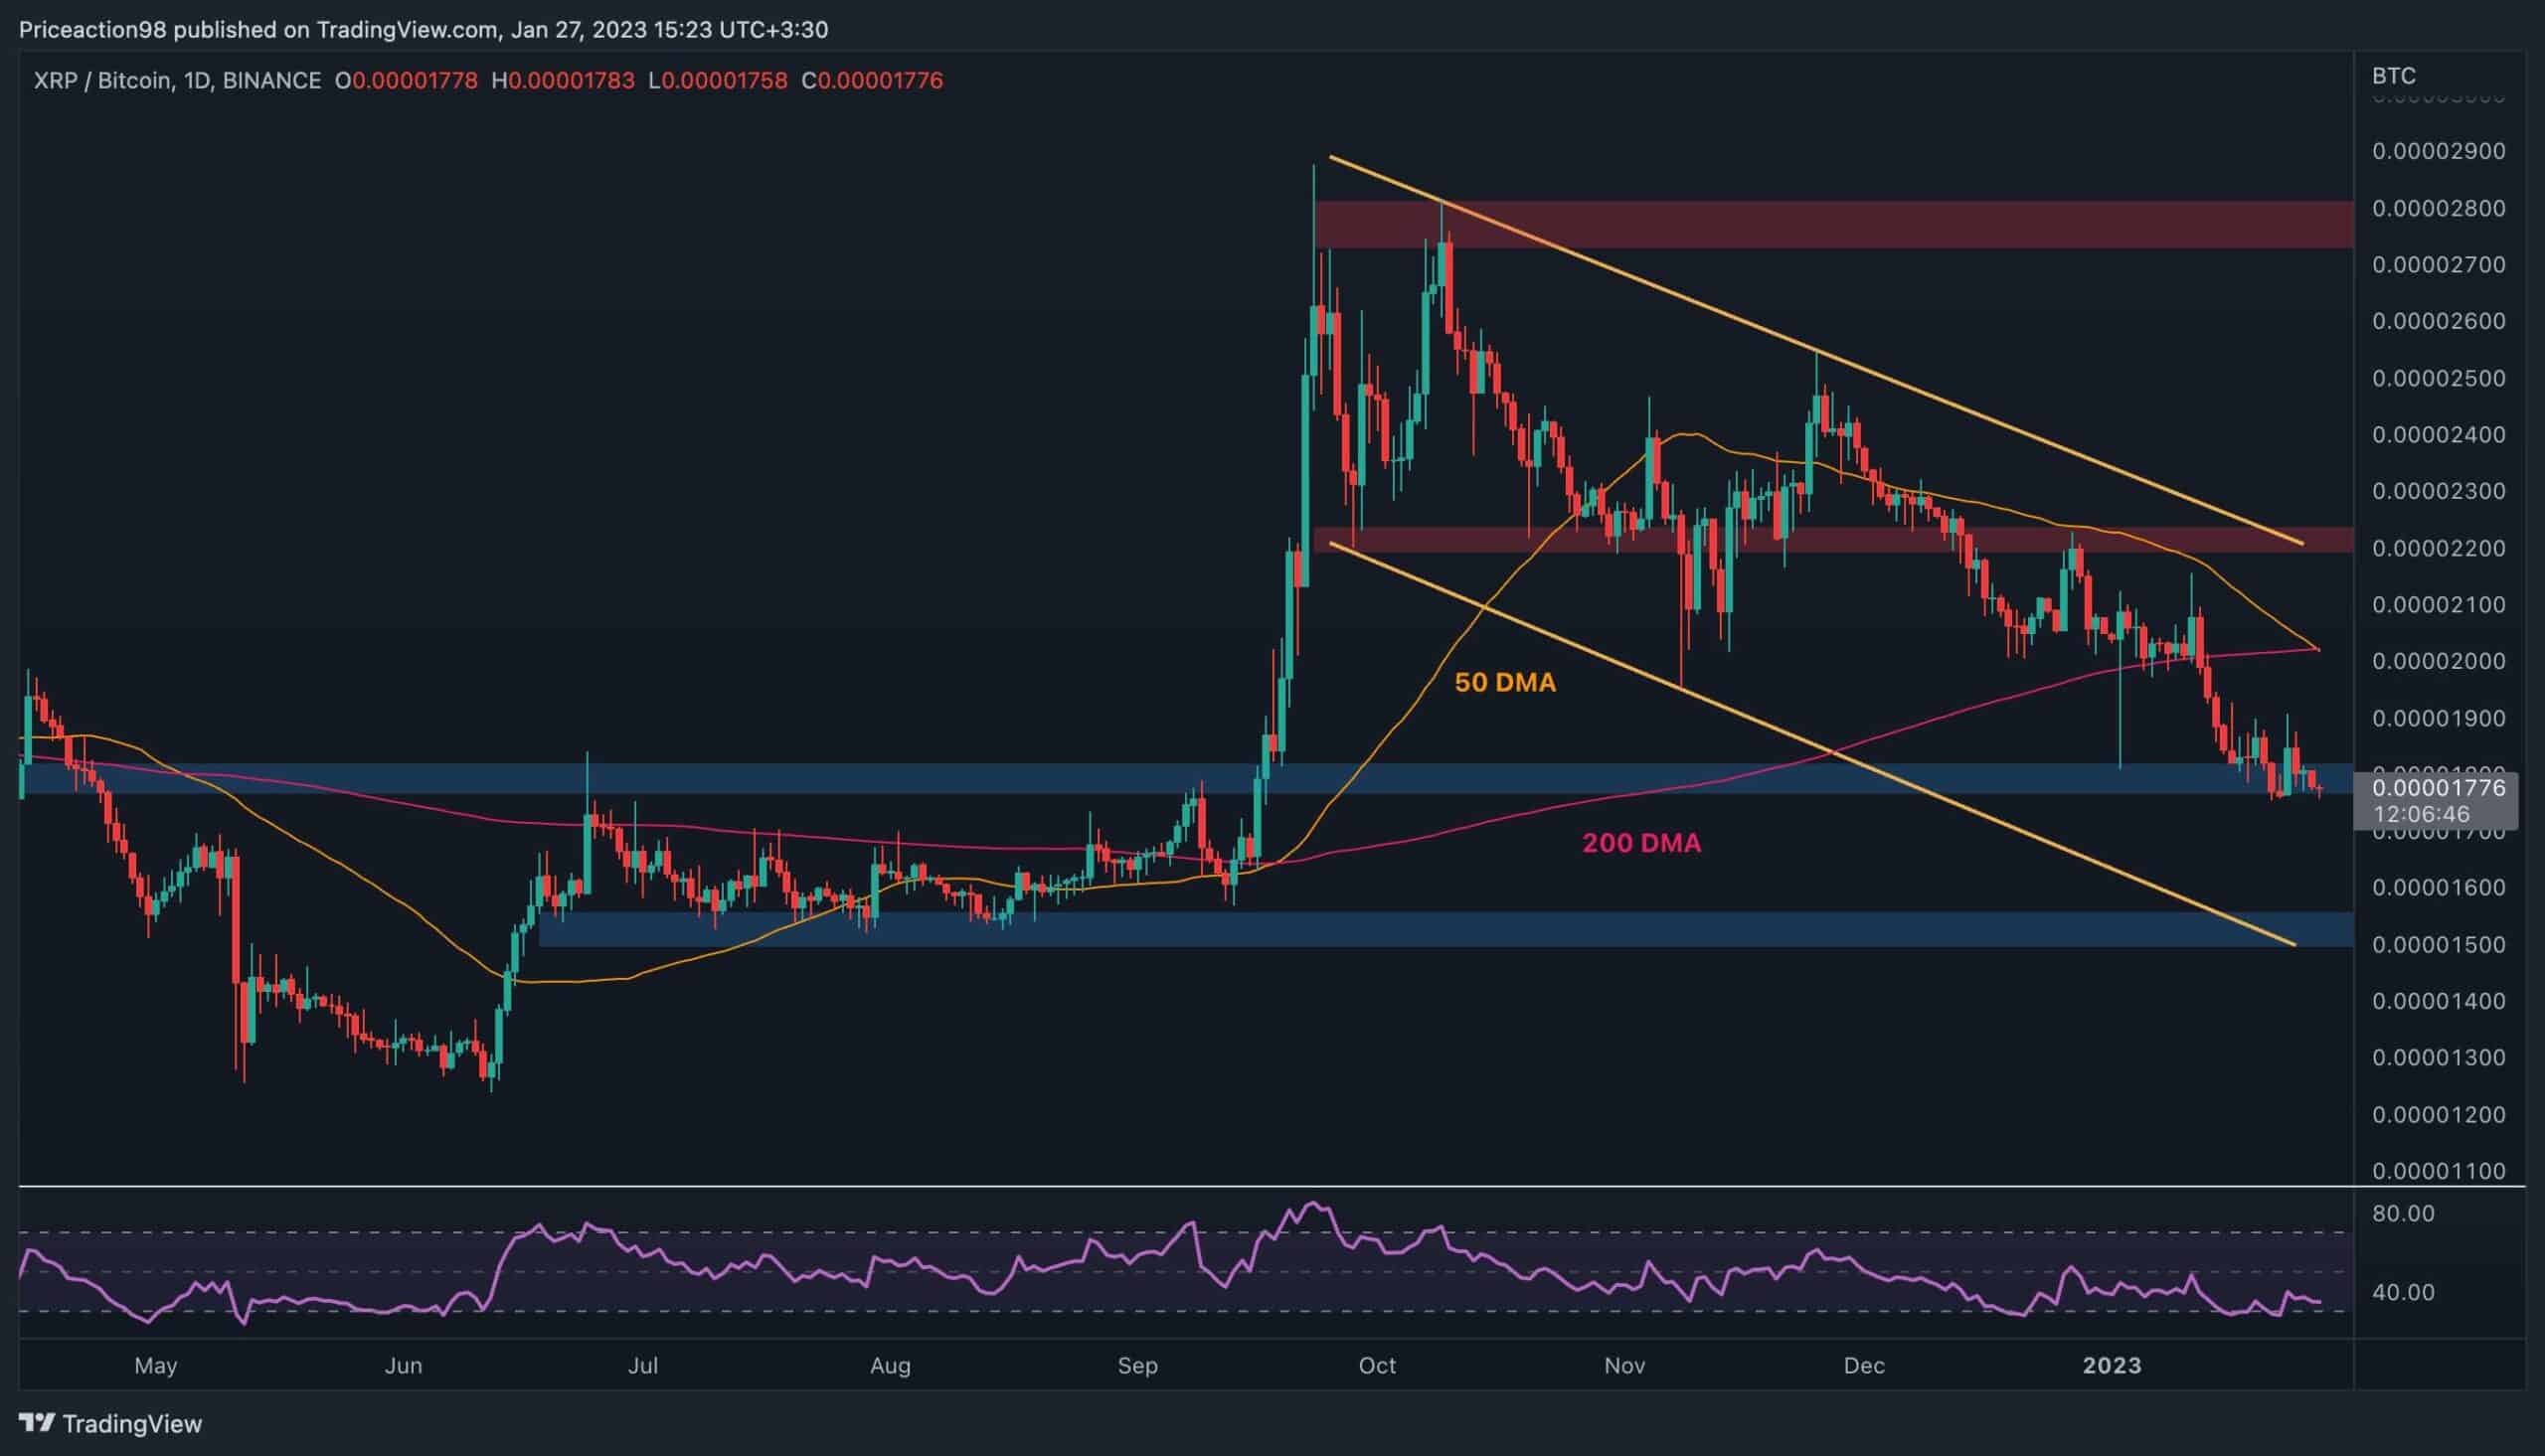
XRP/BTC Daily Chart
Against Bitcoin, the price is seemingly on the verge of breaking the 0.000018 level to the downside after days of consolidation above it. This would lead to a drop towards the lower boundary of the descending channel and the 0.000015 area.
Furthermore, the 50-day MA is also crossing the 200-day MA to the downside, around the 0.00002 mark. This is considered a bearish signal and would further increase the probability of a drop toward the 0.000015 level in the short term.
The post Bearish Signs for Ripple Appear, Will $0.40 Hold? (XRP Price Analysis) appeared first on CryptoPotato.


