
Key Insights
- Ethereum’s upgrade to Proof-of-Stake made it more resistant to shocks from the market. While ETH ended the quarter down 10%, it outperformed close peers such as BTC and SOL.
- The Merge significantly improved key financial fundamentals for Ethereum. Gross protocol issuance was down 87% and was more than offset by the transaction fee burn. Real validator returns increased from 0% to 6%.
- The community was able to overcome its first major challenge of censorship in this new era. Combined efforts between Flashbots and the validators brought censorship down from 78% to 61%.
- Network usage metrics were down across the board as they are typically positively correlated with market sentiment. Transactions, active addresses, decentralized exchange, and lending volumes were all down for the quarter.
- No bear market among Layer-2 solutions. The Q4 trend was the opposite for Layer-2 solutions with transaction activity almost matching that on Layer-1. With further improvements around the corner, this trend is likely to continue.
Primer on Ethereum
The Ethereum blockchain network is a decentralized computation, data storage, and transaction validation platform. The breakthrough introduction of smart contracts and a virtual machine on the network creates a decentralized Turing-complete software solution. There are thousands of individual tokens and applications built on top of the Ethereum blockchain. The protocol gained broad recognition after developing a deep decentralized finance ecosystem and, more recently, interesting Web3 use cases. The protocol made the transition to Proof-of-Stake from Proof-of-Work on September 15, 2022. The next step for Ethereum is to meet the growing demand for blockspace by creating a network of Layer-2 solutions that enable it to scale throughput while maintaining decentralization. Today, Ethereum is the world’s second-largest cryptocurrency by market capitalization.
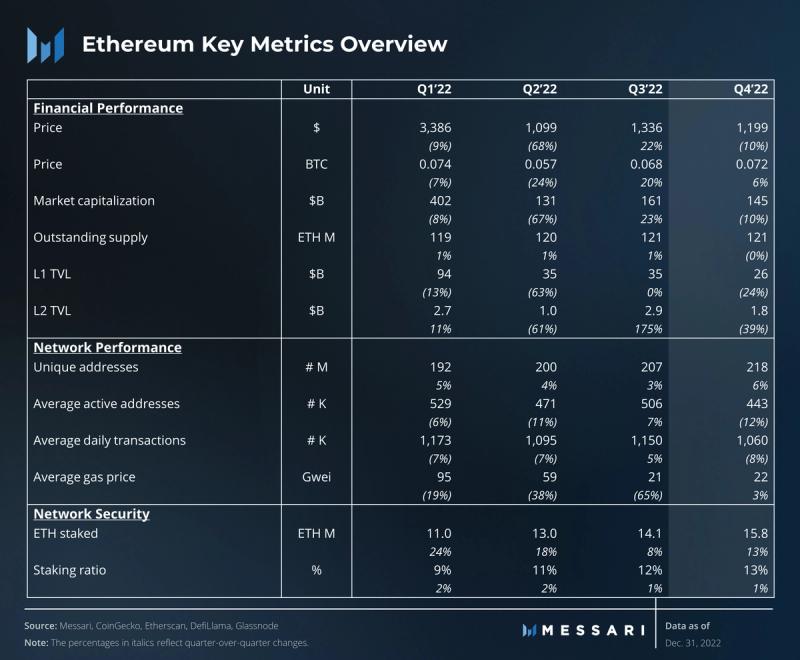
Key Metrics
Performance Analysis
Financial Overview
The quarter was tumultuous with the bankruptcy of FTX / Alameda casting a huge shadow over the cryptoasset ecosystem. However, unlike most other cryptoassets, ETH did not set a new cycle low. Even though ETH ended the quarter down, it outperformed its closest peers. This outperformance came on the back of recent and upcoming upgrades that improve the fundamentals of the protocol.
The Merge (Ethereum’s transition to Proof-of-Stake) successfully took place at the tail end of Q3. Q4 was the first quarter to feel the full effects of this massive upgrade. Among other things, The Merge brought significant improvements to the financials of the protocol.
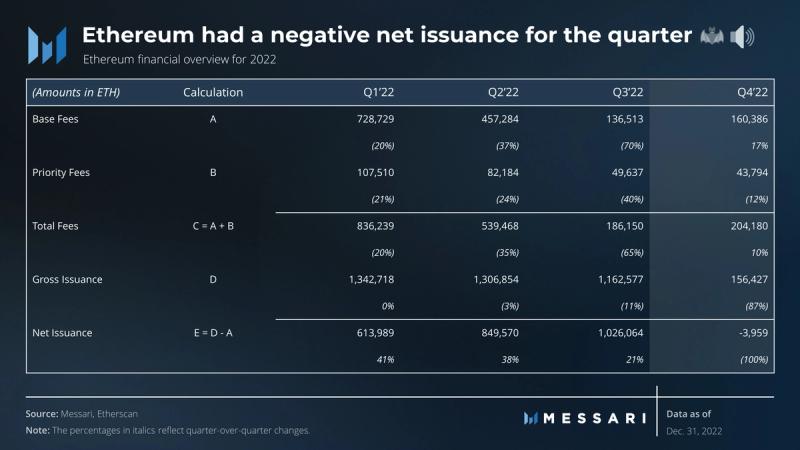
Now that Ethereum mints fewer coins than it burns, it has become one of the few “profit-generating” blockchains. With the transition to Proof-of-Stake, miner rewards were eliminated, and gross issuance fell by 87% to just 156,000 ETH. Gross issuance was surpassed by the 160,000 ETH in burned transaction fees, bringing net issuance to roughly -4,000 ETH. This net negative inflation suggests that Ethereum’s economic policy is sustainable, and the protocol is sufficiently secured by usage.
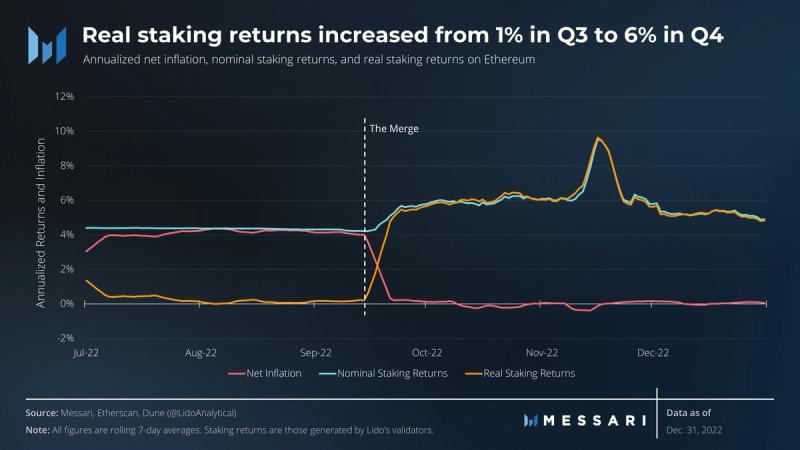
The Merge also vastly improved the economics for stakers. Real staking returns improved from 1% in Q3 to 6% in Q4. The majority of the increase came from a fall in net inflation from 4% to 0%. Fees from tips and MEV formed only a small part of validators’ incomes. However, for a brief period in November, yields shot up over 10% due to the MEV opportunities following the FTX hacker’s trades. If sentiment improves and on-chain activity returns in the coming quarters, validator income could see further growth.
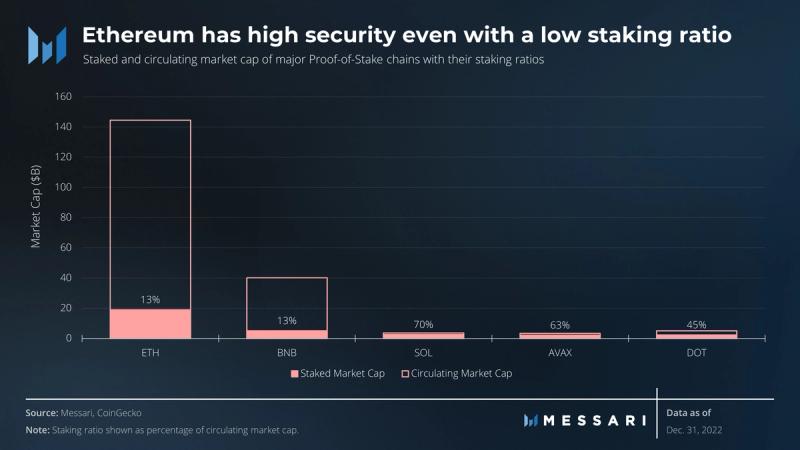
With its rising staking yield, Ethereum now has the highest staked market cap of all PoS chains, sitting at $19 billion. However, its staking ratio is still much lower than chains such as Solana, Avalanche, and Polkadot. So far, Ethereum’s staking experience has been subpar since ETH, once staked, is unable to be withdrawn. Ethereum’s next upgrade will enable staking withdrawals that will derisk staking and likely improve the staking ratio. A higher staking ratio would create greater security for the chain and a lower floating supply for ETH.
Network Overview

A smooth Merge did not rob users of on-chain drama. The network faced its first major challenge when validators started censoring transactions from addresses banned by the United States Office of Foreign Assets Control (OFAC). The portion of blocks by censoring relays peaked at 78% in the middle of November. However, the community, led by the Flashbots team, was able to bring down OFAC compliance to 61% by the end of the quarter. An updated Ethereum roadmap now includes “The Scourge” which will ensure it has “reliable and credibly neutral transaction inclusion.”
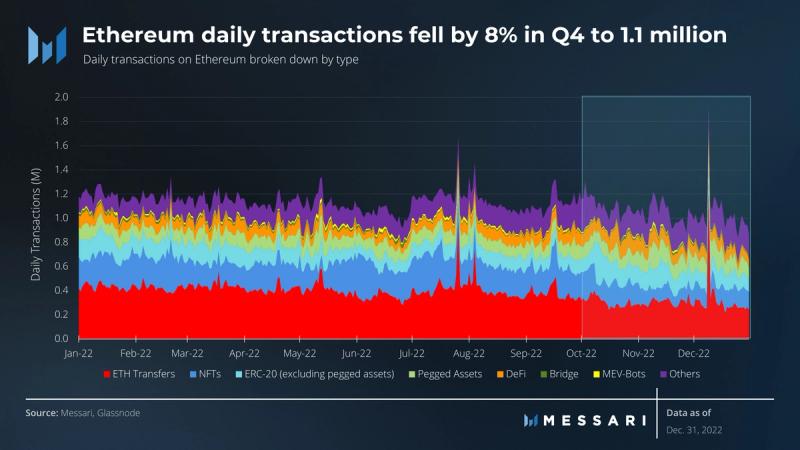
Transaction count on Ethereum saw a minor dip in Q4 after having remained largely range-bound for the whole year. Average daily transactions for the quarter were 1.1 million, down 8% from Q3. NFTs and ETH transfers were the largest contributors to the negative growth, falling 38% and 23%, respectively. Some of this decrease was offset by an increase in activity from ERC-20 tokens, pegged assets, and decentralized finance, up 36%, 22%, and 17%, respectively.
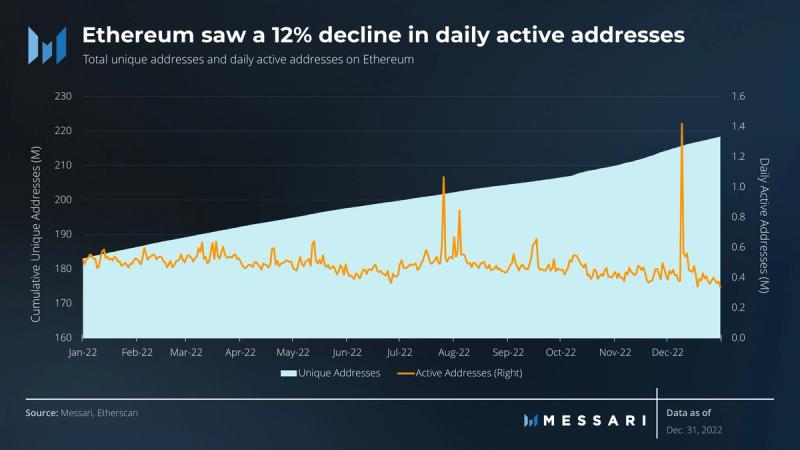
Daily active addresses followed a similar pattern to transactions, falling 12% to 440,000 for the quarter. Ironically, active addresses for Ethereum hit an all-time high of 1.4 million in early December, but it was because of a rather mundane reason: Binance was consolidating its wallets for its Proof-of-Reserves audit. Typically market sentiment and on-chain activity are positively correlated, and as such, it is no surprise that on-chain metrics were unimpressive in Q4.
On a more positive note, Q4 added unique addresses almost twice as fast as Q3. A total of 12 million new unique addresses were added, bringing total unique addresses to 218 million at the end of the quarter.
Market Metrics
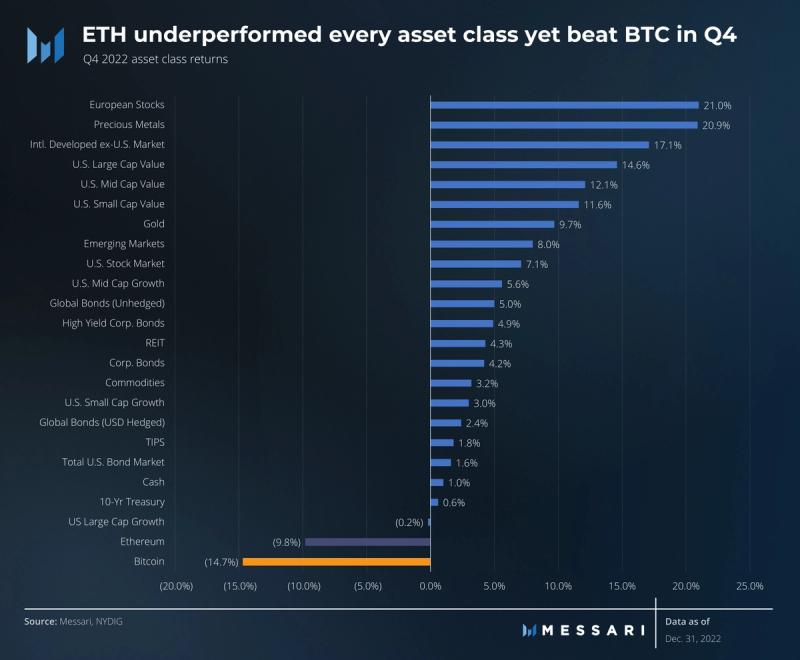
Broadly speaking, Ethereum performed poorly relative to the vast majority of asset classes. This poor performance can be largely attributed to the panic selling that followed the crash of FTX. The black swan event was in no way tied to the performance or integrity of Ethereum’s network, but it still cast a broad shadow over the crypto market.
Nevertheless, Ethereum was able to outperform Bitcoin in a down quarter. Its performance could be due to its lower inflation and reduced technology risk. It could also be a signal that Ethereum is perceived as a safe haven within the digital asset class.
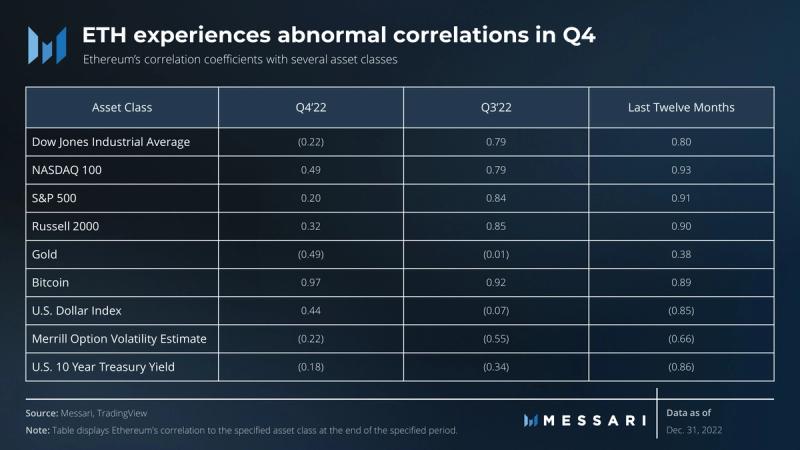
Due to the systematic risk realized by FTX’s bankruptcy, Ethereum experienced abnormal correlations this quarter relative to Q3 and the last 12 months. For example, there was a moderate positive correlation with the U.S. Dollar Index which traditionally maintains a strong negative correlation with digital assets. Despite this abnormal behavior, the digital asset maintained a strong positive correlation with the Dow Jones Industrial Average, NASDAQ 100, S&P 500, and Russell 2000 over the last 12 months. Conversely, it maintained a strong negative correlation with the U.S. Dollar Index and 10-Year Treasury Yield over the same period.
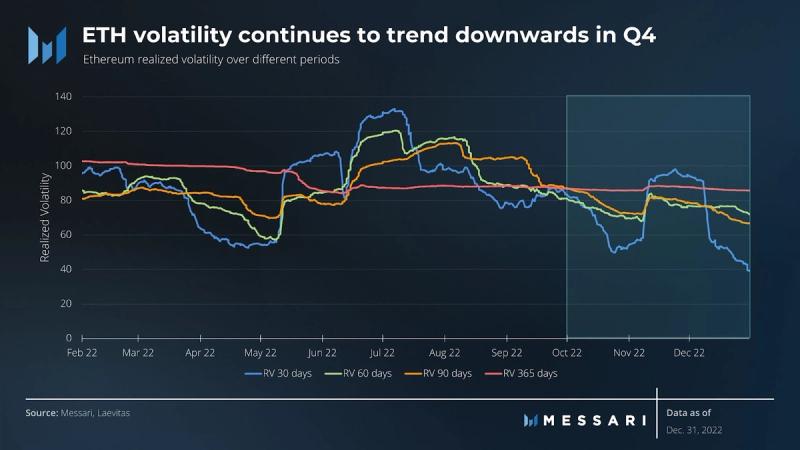
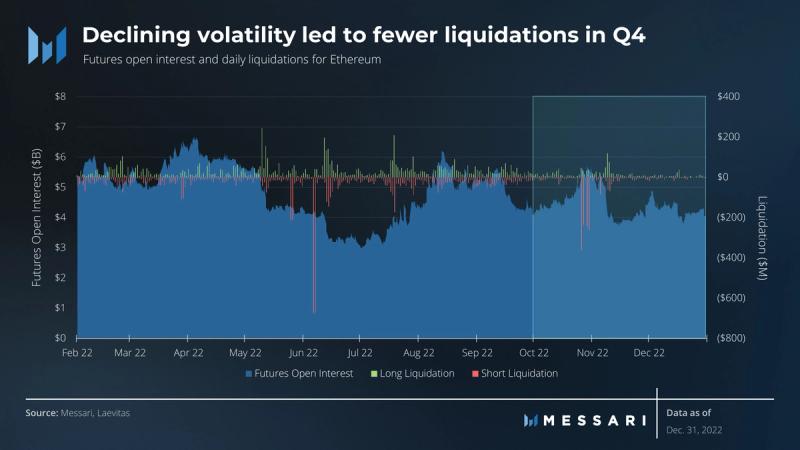
Ethereum realized volatility continued its downward trend from Q3 with a temporary spike around the FTX bankruptcy. This decline in realized volatility subsequently led to fewer liquidations in the quarter. The exceptions to this trend, outside liquidations surrounding FTX, were short liquidations on October 26-27 and October 29-30, totaling $598.06 million and $507.38 million, respectively. This was due to spot prices breaking and first holding above $1,500, then $1,600, and finally creating a short squeeze. Notably, futures open interest finished slightly down, indicating potential weakness in the bearish trend.
Sectoral Overview
Stablecoins
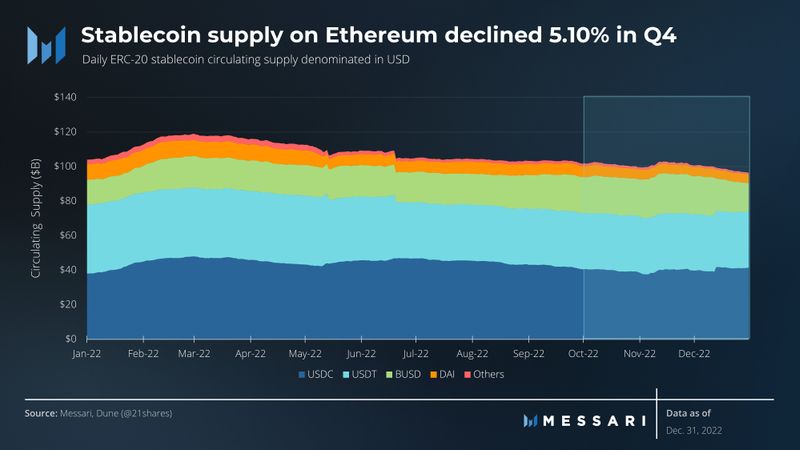
Unsurprisingly, stablecoin supply shrank in Q4, likely due to investors exiting the asset class following the bankruptcy of FTX. Supply bumped higher in early November during the market selloff leading into the announcement of FTX’s bankruptcy. Then supply began to decline more quickly as investors converted to fiat currencies for withdrawals off exchanges. Remarkably, USDC and USDT supply diverged from the overall trend and experienced a sharp increase in supply on December 13. While USDT supply finished flat for the quarter, USDC supply increased 2%. BUSD experienced a 15% decline in supply over the same 24 hour period.
These trends can be partially explained by two distinct events tied to the stablecoin market. First, Coinbase announced on December 9 that it would be waiving fees for global retail customers to convert USDT to USDC. The exchange urged its users to switch to USDC due to concerns that USDT would not be able to hold its peg to the U.S. dollar. USDT traded as low as 93 cents following FTX’s bankruptcy.
Second, following the bankruptcy of FTX, investors were skeptical of other unregulated exchanges domiciled outside the United States, namely Binance. This skepticism likely contributed to investors converting out of BUSD and into USDC and USDT as well as outright withdrawing from the exchange. Binance even briefly paused USDC withdrawals to facilitate token swaps of USDC for BUSD.
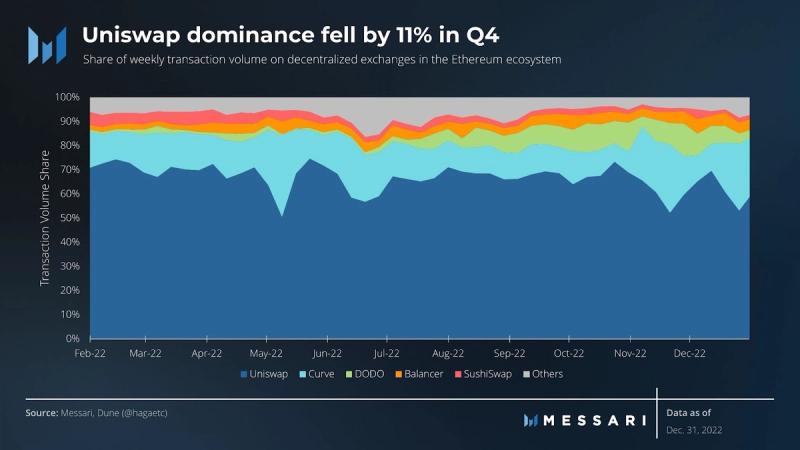
Decentralized Exchanges (DEXs)
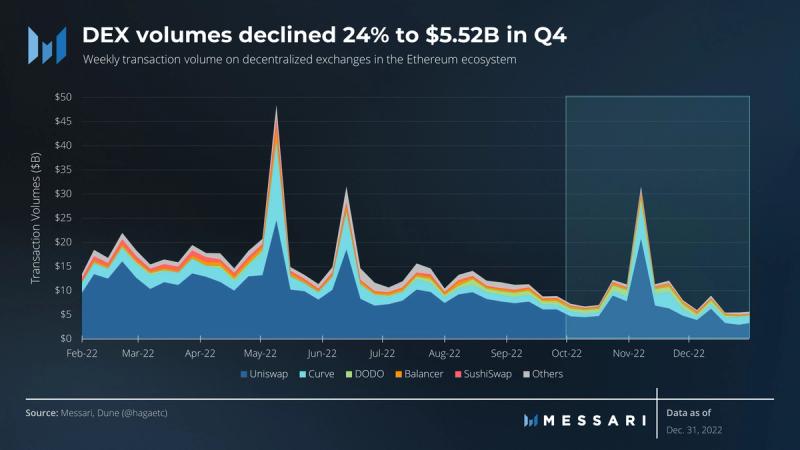
In Q3, DEXs averaged $122 billion in weekly transaction volume. In Q4, this dropped to $10 billion. Uniswap’s dominance decreased from 69% at the end of Q3 to 53% at the end of December. Uniswap’s average dominance was 64% throughout Q4. Notably, Curve’s volume share increased from 11% at the end of Q3 to 28% at the end of December.
Borrowing and Lending
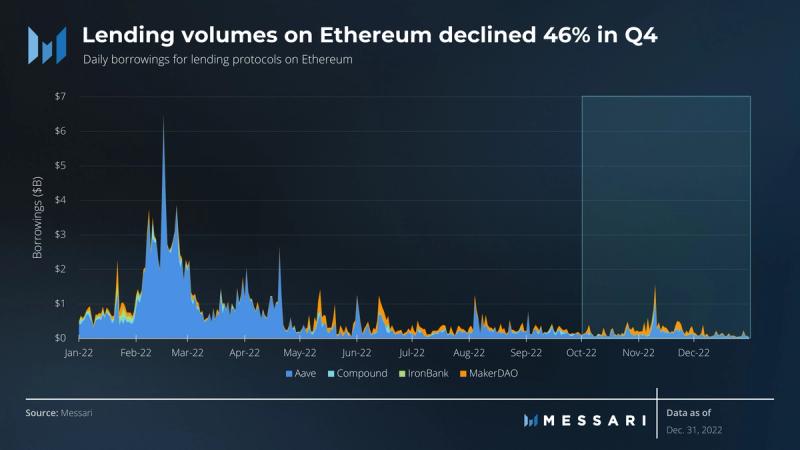
Daily lending volumes were nearly halved in Q4, falling 46%. The daily average fell from $295 million per day in Q3 to $221 million in Q4. For perspective, 2022’s lending volume peaked in Q1 with a daily average of $1.5 billion, ~7 times larger than Q4.
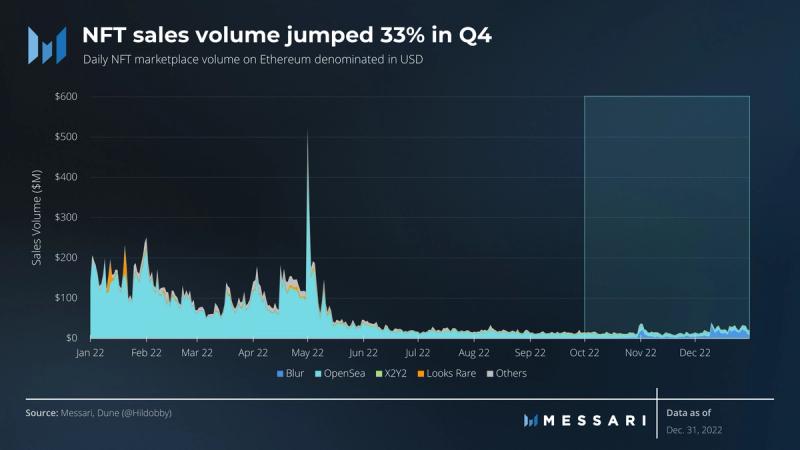
Non-Fungible Tokens (NFTs)
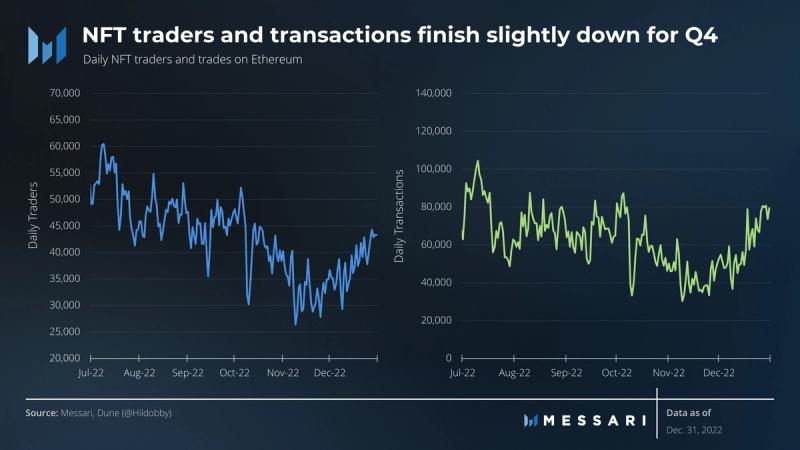
Daily NFT traders and transactions rebounded alongside sales volume in Q4. Daily NFT traders declined 10% while daily transactions only declined 3% for the quarter. At the same time, Q4 daily sales volume increased 33%. Average daily sales volume declined from $18.1 million in Q3 to $17.7 million in Q4. Sudoswap, which launched in Q3 with a novel marketplace approach, maintained an average NFT market share of 1.2% in Q4.
Infrastructure Overview
Layer-2 Solutions
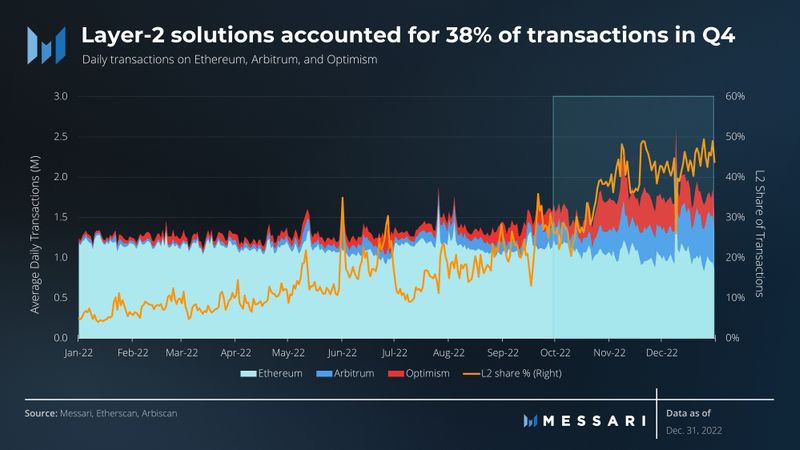
While the Ethereum base layer operates at full capacity and transaction growth remains stagnant, there was significant growth in its Layer-2 (L2) solutions. Average daily transactions on Arbitrum and Optimism grew ~150% in Q4 to 320,000 and 350,000, respectively.
The year began with major L2s having a minuscule 5% of the transaction share, but it ended with L2s almost on par with the base layer and nearing 50% transaction share of the entire ecosystem. It would seem that the L2 scaling vision for Ethereum is being realized.
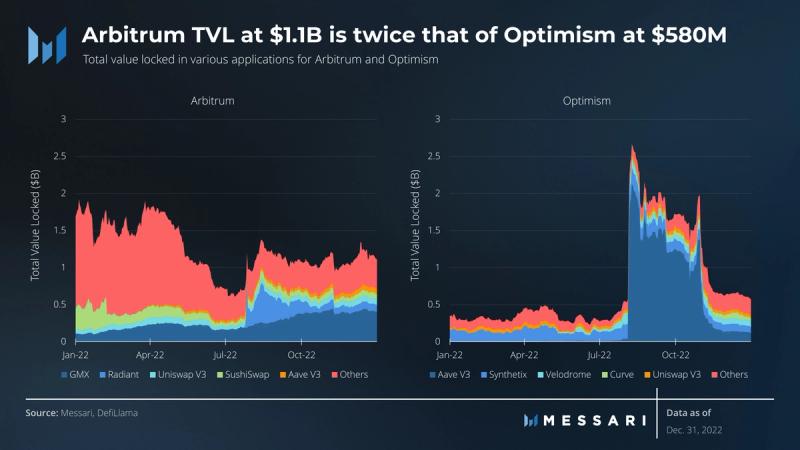
Total value locked (TVL) on Arbitrum was largely flat for the quarter, hovering around $1.1 billion. GMX is the star application on Arbitrum with a TVL of $400 million. Radiant, Uniswap, SushiSwap, and Aave are the other major applications on Arbitrum, but their TVLs are much smaller, averaging less than $100 million each.
Optimism’s TVL saw a massive decline of 67% to $580 million. Aave experienced the largest outflow with its TVL shrinking by 90% as its liquidity mining program came to an end. Still, at the end of the quarter, Aave had the largest TVL with $120 million, followed by Synthetix and Velodrome at ~$80 million each.
Even without a token, Arbitrum has managed to create significant traction. However, the L2 battle is far from over. There are major upgrades from multiple teams planned in the future:
- An upcoming architectural upgrade to Optimism, Bedrock, will make it cheaper, more modular, and future-proof. OP Labs intends to make Optimism the center of its own interconnected network of chains, and Bedrock is the first step towards that vision.
- Matter Labs, the team behind zkSync, raised $600 million in a Series-C round. According to Matter Labs, zkSync’s zk-EVM rollup is in its “baby alpha” phase and is expected to go into “fair launch alpha” in Q1 2023.
- ConsenSys, the team behind fundamental Ethereum infrastructure like Metamask and Infura, has also thrown its hat among the zk-EVM rollups. It announced a private beta testnet that will open to external users in Q1 2023.
Relay and Builders
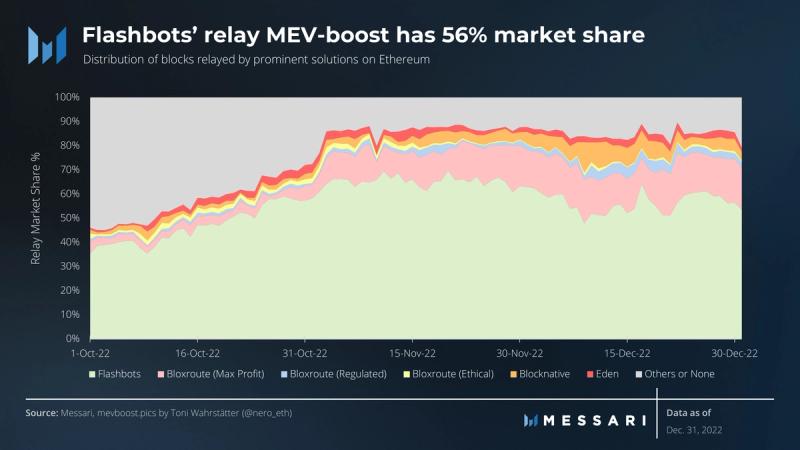
Flashbots is the pioneer for MEV relays. Even though it open-sourced its tech, its share remains dominant at 56% for the quarter. However, towards the end of the quarter, other relays chipped away at Flashbots’ lead somewhat. This trend seems to be encouraging because decentralization among relays is beneficial for the ecosystem. Greater and diverse relays allow for greater censorship resistance and a higher degree of data availability.
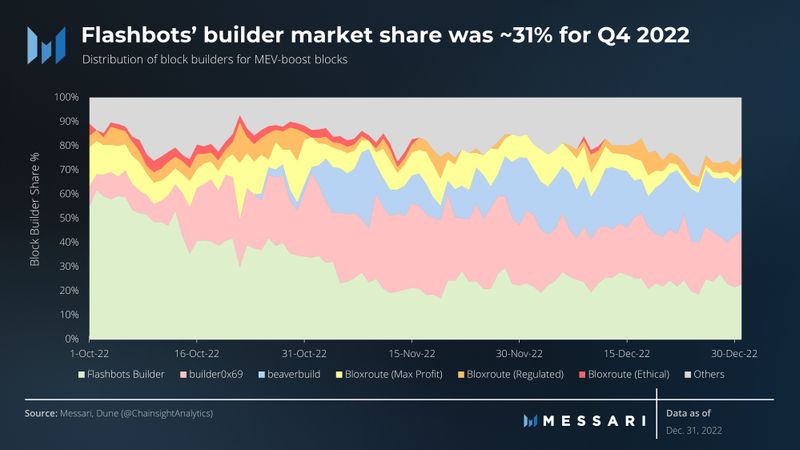
The block builder market is more competitive. Flashbots started the quarter with a significant majority of ~60% but ended the quarter with only 23% market share. By the end of the quarter, builder0x69 and beaverbuild were building as many blocks as Flashbots with over 20% market shares each. In addition, Bloxroute’s relays had a combined average of 15% for the quarter.
Healthy competition among builders is good for Ethereum and its validators. For Ethereum, it increases censorship resistance. For validators, it translates to greater revenue share from MEV as the builders compete to get their transactions included.
Staking
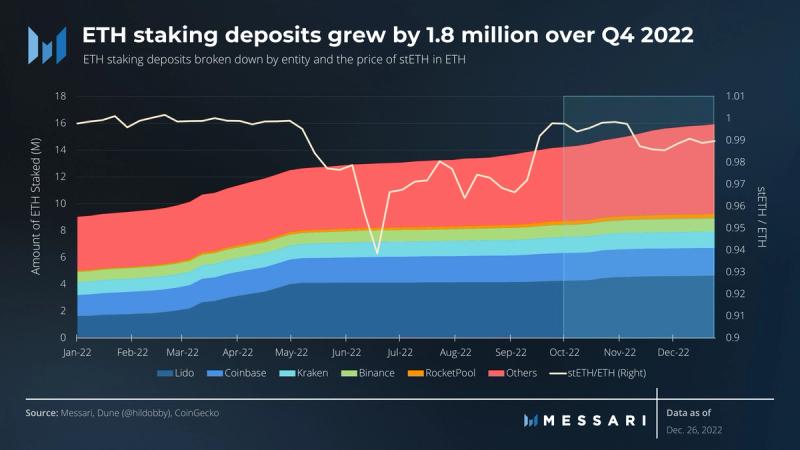
After a successful Merge, staking was derisked to a large extent, and Lido-staked ETH (stETH) started trading at parity to ETH. It was during this period that the majority of the 1.8 million ETH was staked during the quarter. After the collapse of FTX, however, stETH started trading at a small discount to ETH again, closing the year at 0.99 ETH.
Among the major entities, Lido remains the largest staking provider with 29% market share and 400,000 ETH added during the quarter. Following Lido, Binance and RocketPool contributed 80,000 ETH and 60,000 ETH, respectively. Even though Coinbase is the second-largest staking provider, it had a quarter of low growth of 10,000 ETH.
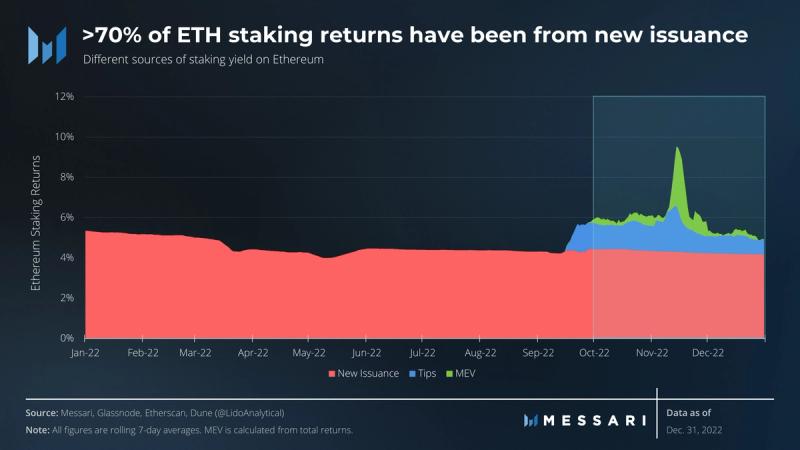
Annualized validator returns for the quarter grew 6%, up from 4.6% in Q3. The majority of the yield was on the back of new issuance which contributed 4.3% of the 6%. All of the increase, however, came from execution layer rewards which used to be earned by miners. Transaction tips and MEV payments contributed 1.2% and 0.5% of the staking yield, respectively.
Competitive Analysis
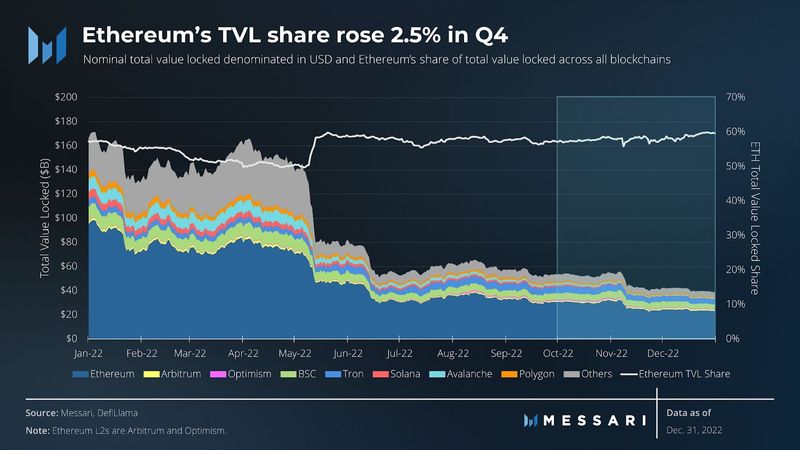
Ethereum ended Q4 with a 60% share of total blockchain TVL, or 64% including L2s. The blockchain’s TVL declined 24% from $31 billion at the end of Q3 to $23 billion at the end of December. The collective TVL of Ethereum’s Layer-2 scaling protocols, Arbitrum and Optimism, declined by 18% this quarter with $1.53 billion TVL.
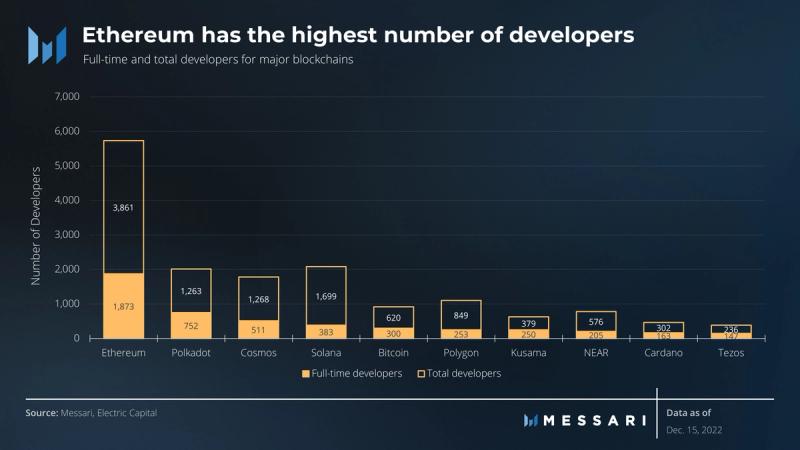
On the other side of the network, developer activity remained strong for Ethereum. Per a report by Electric Capital, Ethereum continues to lead all other ecosystems in both full-time developer count and total developer count. Of the top 10 ecosystems, Ethereum has a 39% share of full-time developers and 36% share of total developers. Ethereum also added the most full-time developers over 2022 at 155 developers.
Qualitative Analysis
Ethereum’s transition to Proof-of-Stake had been many years in the making. The operation had been likened to that of flying a jet and changing its engine mid-flight. There were literally billions of dollars at stake, yet with careful research, development, and implementation, the transition took place smoothly without any hiccups. After the success of this massive accomplishment, perhaps the first and only of its kind, there has been a palpable change in sentiment in the Ethereum community. No longer are Ethereum upgrades a pie-in-the-sky multi-year vision; they are very real and sometimes timely. The core developers seem to have a new interest in keeping deadlines, already planning for more upgrades in the future.
The next upgrades, Shanghai for the execution layer and Capella for the consensus layer, will enable withdrawals of ETH from the staking contract. This ability will finally bring the ETH staking experience on par with other Proof-of-Stake chains. The upgrades are slated to go live on the mainnet in late Q1 2023, with testnet implementations going live in February. There is room for optimism that the deadline will be met, especially considering that the core developers have decided to drop other upgrades in favor of a timely deployment.
After Shanghai, the Cancun upgrade is next on the horizon. Some of the upgrades that were foregone from Shanghai will likely form a part of Cancun. EIP-4844 or proto-danksharding is a much-awaited upgrade to Ethereum that introduces ephemeral data storage or storage blobs. These storage blobs will allow rollups to settle transactions without competing with other Ethereum transactions, potentially making rollups 100x cheaper. EIP-4844 needs a trusted setup to launch, and the multi-party setup is now live for anyone to join.
Cancun will also likely include upgrades to the Ethereum Virtual Machine (EVM) under the header of EVM Object Format (EOF). These upgrades will make some transactions cheaper, simplify smart contract implementations, and make future upgrades to the EVM more seamless. Cancun is expected to go live later in 2023.
Closing Summary
The 2021 bull run had Ethereum face serious competition for the first time in its history. Alt-Layer-1s were the favorable trade as Ethereum suffered through congestion and high gas fees. While the pressure from alt-Layer-1s has subsided in the bear, the threat still remains. Ethereum has been a slow giant moving carefully in order to not break things, and its growth reached a long-awaited crescendo with The Merge. The next few upgrades, on track to take place in the upcoming quarters, will make Ethereum and its Layer-2s the tools to compete with alt-Layer-1s at a technical level. Adoption was never a problem for Ethereum, and now, the tech is finally catching up.


