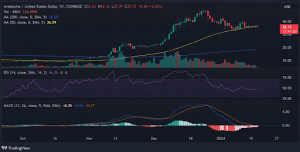
- Avalanche trades between $30.28 and $41.11, facing a potential bearish trend due to weak technical indicators like a low RSI and negative CCI.
- Arbitrum has seen an 80% surge in the past month but recently experienced a 10% decline, indicating market volatility and uncertain future direction.
Avalanche (AVAX) and Arbitrum (ARB) have been attracting significant attention from investors and market analysts alike. Their recent activities and market positions offer insights into the broader dynamics of the crypto world.
Avalanche’s Market Oscillation
Avalanche has been making waves in the crypto market, marked by its trading activity oscillating between the support level of $30.28 and a resistance level of $41.11. This tightrope walk highlights the asset’s current instability and the critical juncture at which it stands.

The Exponential Moving Averages (EMA) for Avalanche presents a clustered scenario, with the 10-day EMA at $35.62, the 50-day EMA at $36.17, and the 200-day EMA at $36.48. These figures suggest a potential consolidation in this price range.
However, technical indicators such as the Relative Strength Index (RSI) standing at a modest 43.46 and the Stochastic %K at 37.16 points towards a lack of strong upward momentum. This sentiment is further reinforced by the Average Directional Index (ADI), which is at a low of 10.89, indicating a weak trend strength. Additionally, the Commodity Channel Index (CCI), deeply ensconced at -222.24, coupled with a slightly bearish MACD Level at -0.21, augments the bearish outlook.
Arbitrum’s Volatile Path
On the other hand, Arbitrum, a key player in Ethereum’s layer-2 scaling solutions, has shown a volatile trajectory. Currently trading between a first support level at $1.59 and a first resistance level at $2.43, ARB has experienced a significant 80% surge over the past month, countered by a 10% decline this week. This juxtaposition of rapid growth against short-term decline highlights the complexities of predicting its market movements.
The technical indicators for ARB mirror this uncertainty. The EMAs at 10, 50, and 200 days stand at $2.01, $2.05, and $1.74, respectively, suggesting a struggle to find a stable trajectory amidst market fluctuations. The Momentum and MACD indicators for ARB, currently at -0.1465 and -0.0403, hint at a cautious market sentiment. Furthermore, the RSI at 38.84 suggests a cautious approach from investors.

Balancing Bullish Hopes and Bearish Realities
For Avalanche, the bullish scenario hinges on the growth in Daily Active Addresses and Transactions on the network. An uptick in Avalanche’s on-chain activity, particularly fueled by new subnet technology, could turn the tide in its favor. However, the bearish scenario cannot be overlooked, underscored by a significant drop in social sentiment and an 11% value decline in the past month.
Arbitrum’s prospects also present a mixed bag. The bullish scenario is backed by impressive trading volumes on its decentralized exchanges and a record-high Total Value Locked (TVL) of $2.64 billion. However, the bearish outlook is driven by the market’s volatility and intense competition in the Layer-2 space. A failure to maintain its position above its current support could see the token testing lower supports.
Both Avalanche and Arbitrum are at pivotal points in their market journey. While potential bullish scenarios exist for both, underscored by on-chain activities and trading volumes, the bearish indicators cannot be ignored. The uncertain market dynamics and fluctuating technical indicators suggest that investors approach these assets with a balanced perspective, acknowledging both the opportunities and the risks involved.


