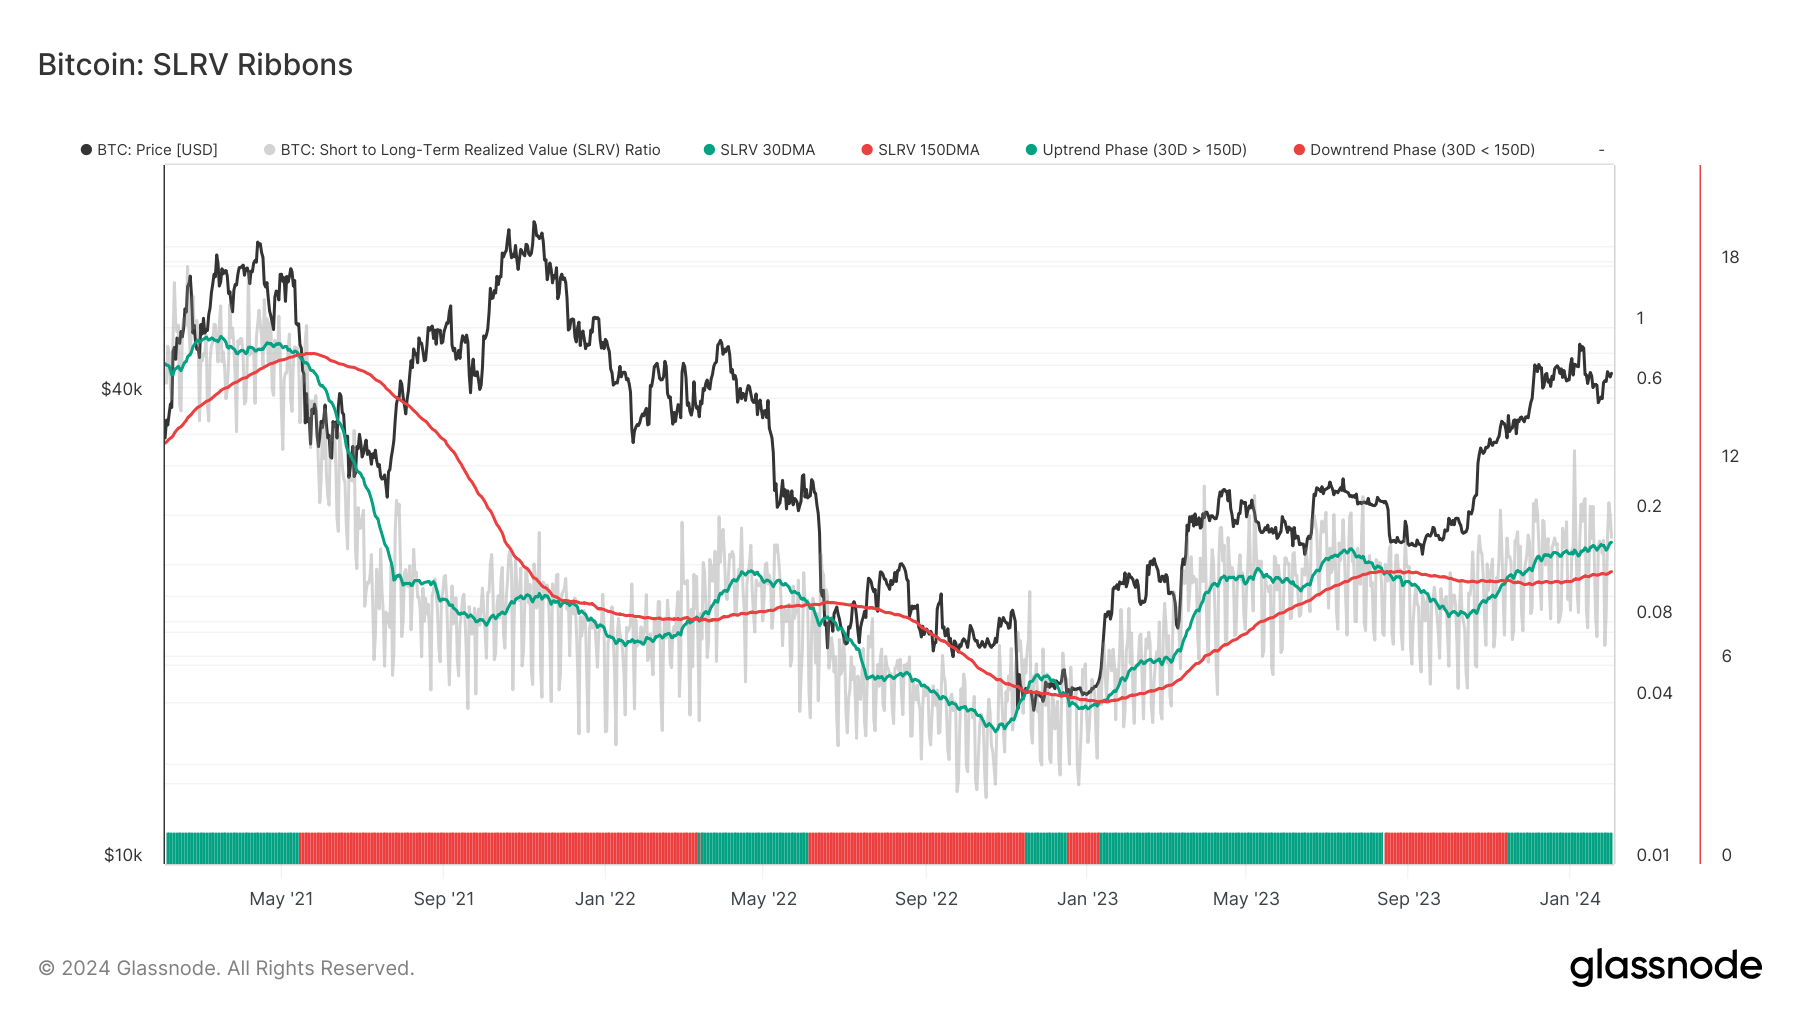
The short-to-long-term realized value (SLRV) ratio is an often-overlooked metric that provides nuanced insights into investor sentiment. The ratio compares the percentage of Bitcoin that was last moved within a short timeframe (24 hours) against the percentage moved in a longer timeframe (6-12 months) to show whether the market leans more towards hodling or trading.
However, the SLRV ratio alone usually isn’t enough to identify broader trends, as there are significant daily variations in the metric. Applying and analyzing the ratio through moving averages, especially the 30-day simple moving average (SMA) and the 150-day SMA, allows us to get a clear picture of sustained market trends.
On Feb. 1, the SLRV 30D SMA reached its highest level since July 2021 as Bitcoin’s price crossed $43,000. This peak represents a continuation of a positive uptrend that began on Nov. 14, 2023, when the SLRV 30D SMA crossed above the 150D SMA.

The SLRV 30D SMA reaching levels not seen in two and a half years shows a significant increase in short-term transactional activity relative to long-term holding. This could be attributed to a myriad of different factors, but it’s usually a result of price volatility. The rise in short-term transactional volume often correlates with heightened market speculation as investors and traders rush to capitalize on price movements. It can indicate a market driven by bullish sentiment or increased speculative interest spurred by recent market developments.
The introduction and adoption of spot Bitcoin ETFs in the U.S. most likely played a significant role. The highly-anticipated trading product has pushed Bitcoin into the mainstream, bringing institutions and advanced investors from tradfi into the market. Aside from having a psychological effect on the market and boosting investor confidence in BTC, these ETFs also provide liquidity to Bitcoin. This increased liquidity can cause higher trading volumes, as investors can enter and exit their positions in Bitcoin through the ETFs more quickly, causing spikes in the SLRV 30D SMA as a result.
It’s not just the rise in the SLRV 30D SMA that shows a change in market sentiment. Its sustained position above the 150D SMA since mid-November shows that short-term transactional activity not only spiked but maintained a higher level over an extended period.
The durability of this trend, which is on its way to enter its third consecutive month, shows that market activity isn’t a short-lived speculative burst but a more entrenched behavior pattern among investors.
Historically, short-term SMAs crossing above long-term SMAs have been used as a technical indicator for positive momentum and potential bullish trends in various assets, including Bitcoin. The extended period where the SLRV 30D SMA remains above the 150D SMA could show a broader market transition from risk-off to risk-on allocations, where investors are more willing to engage in speculative investments or allocate a larger portion of their portfolio to Bitcoin.
The post Short-term trading volume peaks as Bitcoin crosses $43,000 appeared first on CryptoSlate.


