

Analyzing trading volumes across centralized exchanges (CEXs) allows us to understand trade distribution across various platforms and identify broader market trends. Knowing where Bitcoin is being traded and how much of it is being traded provides insights into market liquidity, investor sentiment, and the overall health of the trading environment.
Tracking trading volumes is particularly important in periods preceding and following significant regulatory changes or market events, as they can lead to substantial changes in trading activity.
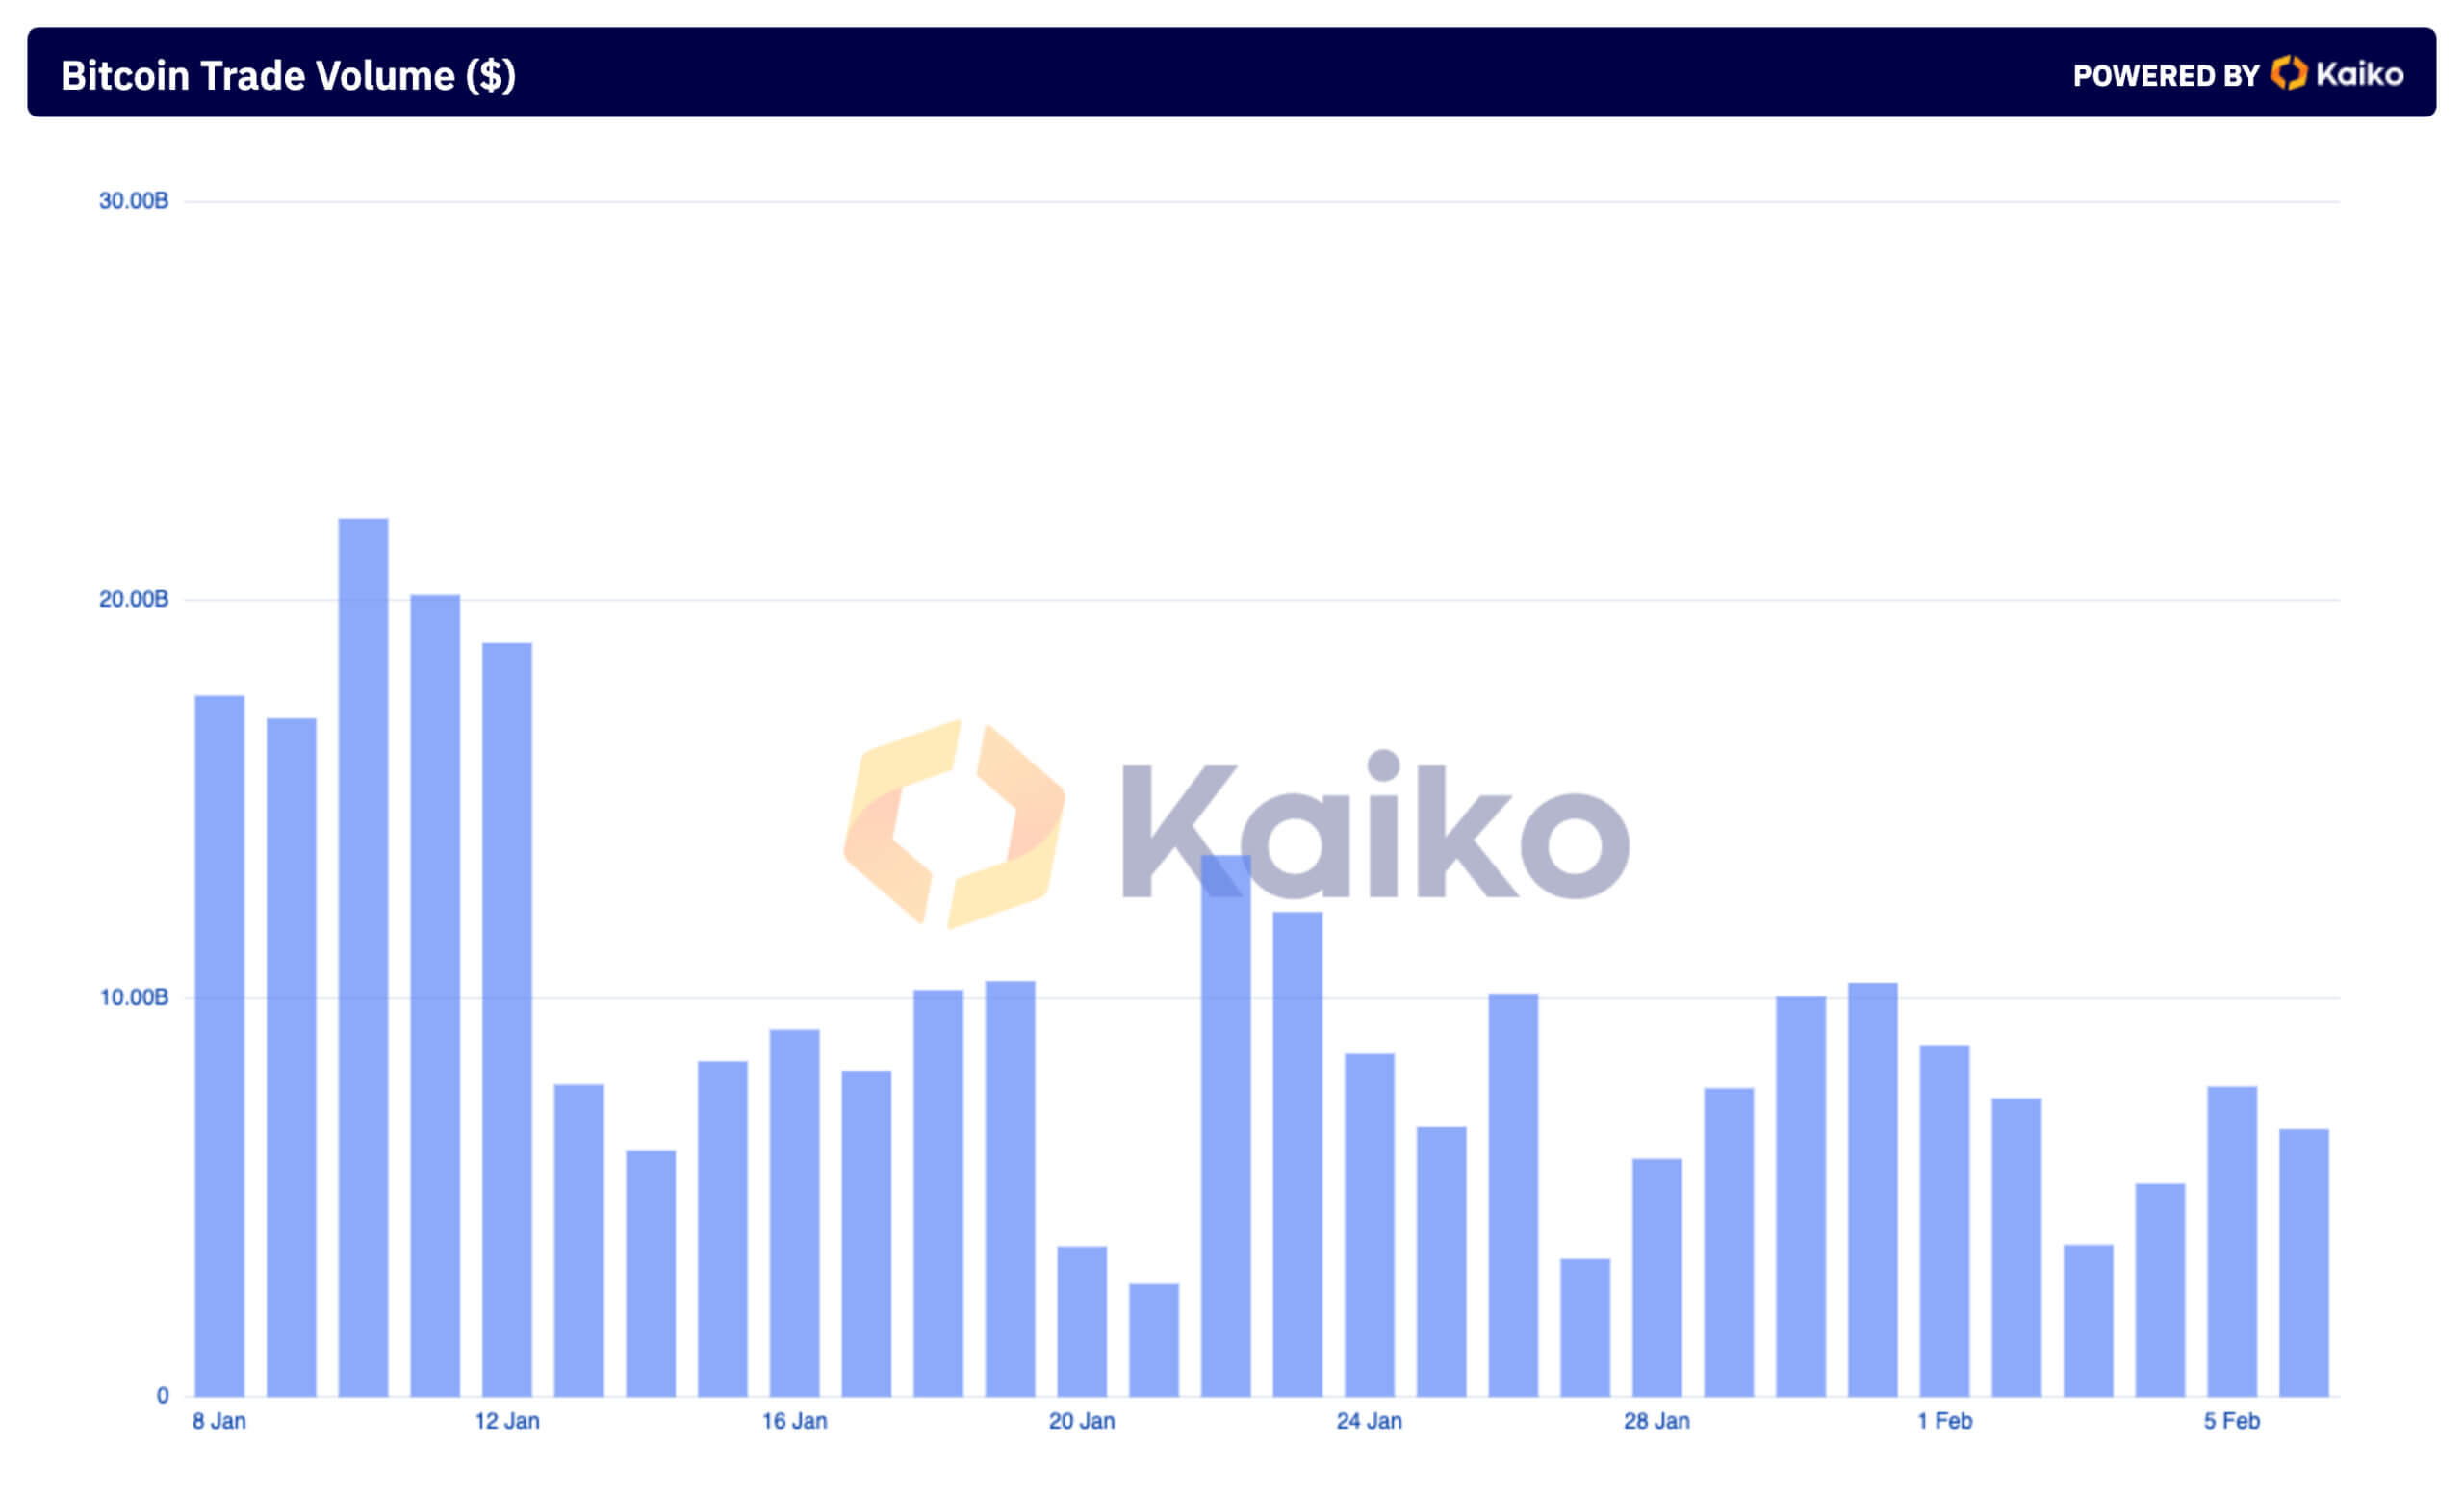
The approval of spot Bitcoin ETFs in the U.S. had a significant effect on trading volumes and patterns across centralized exchanges. On Jan. 10, the day of the ETF approval, trading volumes across 33 centralized exchanges tracked by Kaiko soared to $22.04 billion, with trade counts reaching 17.87 million. This spike shows the market’s aggressive response to the ETFs, ultimately leading to volatility and a sharp drop in Bitcoin’s price.
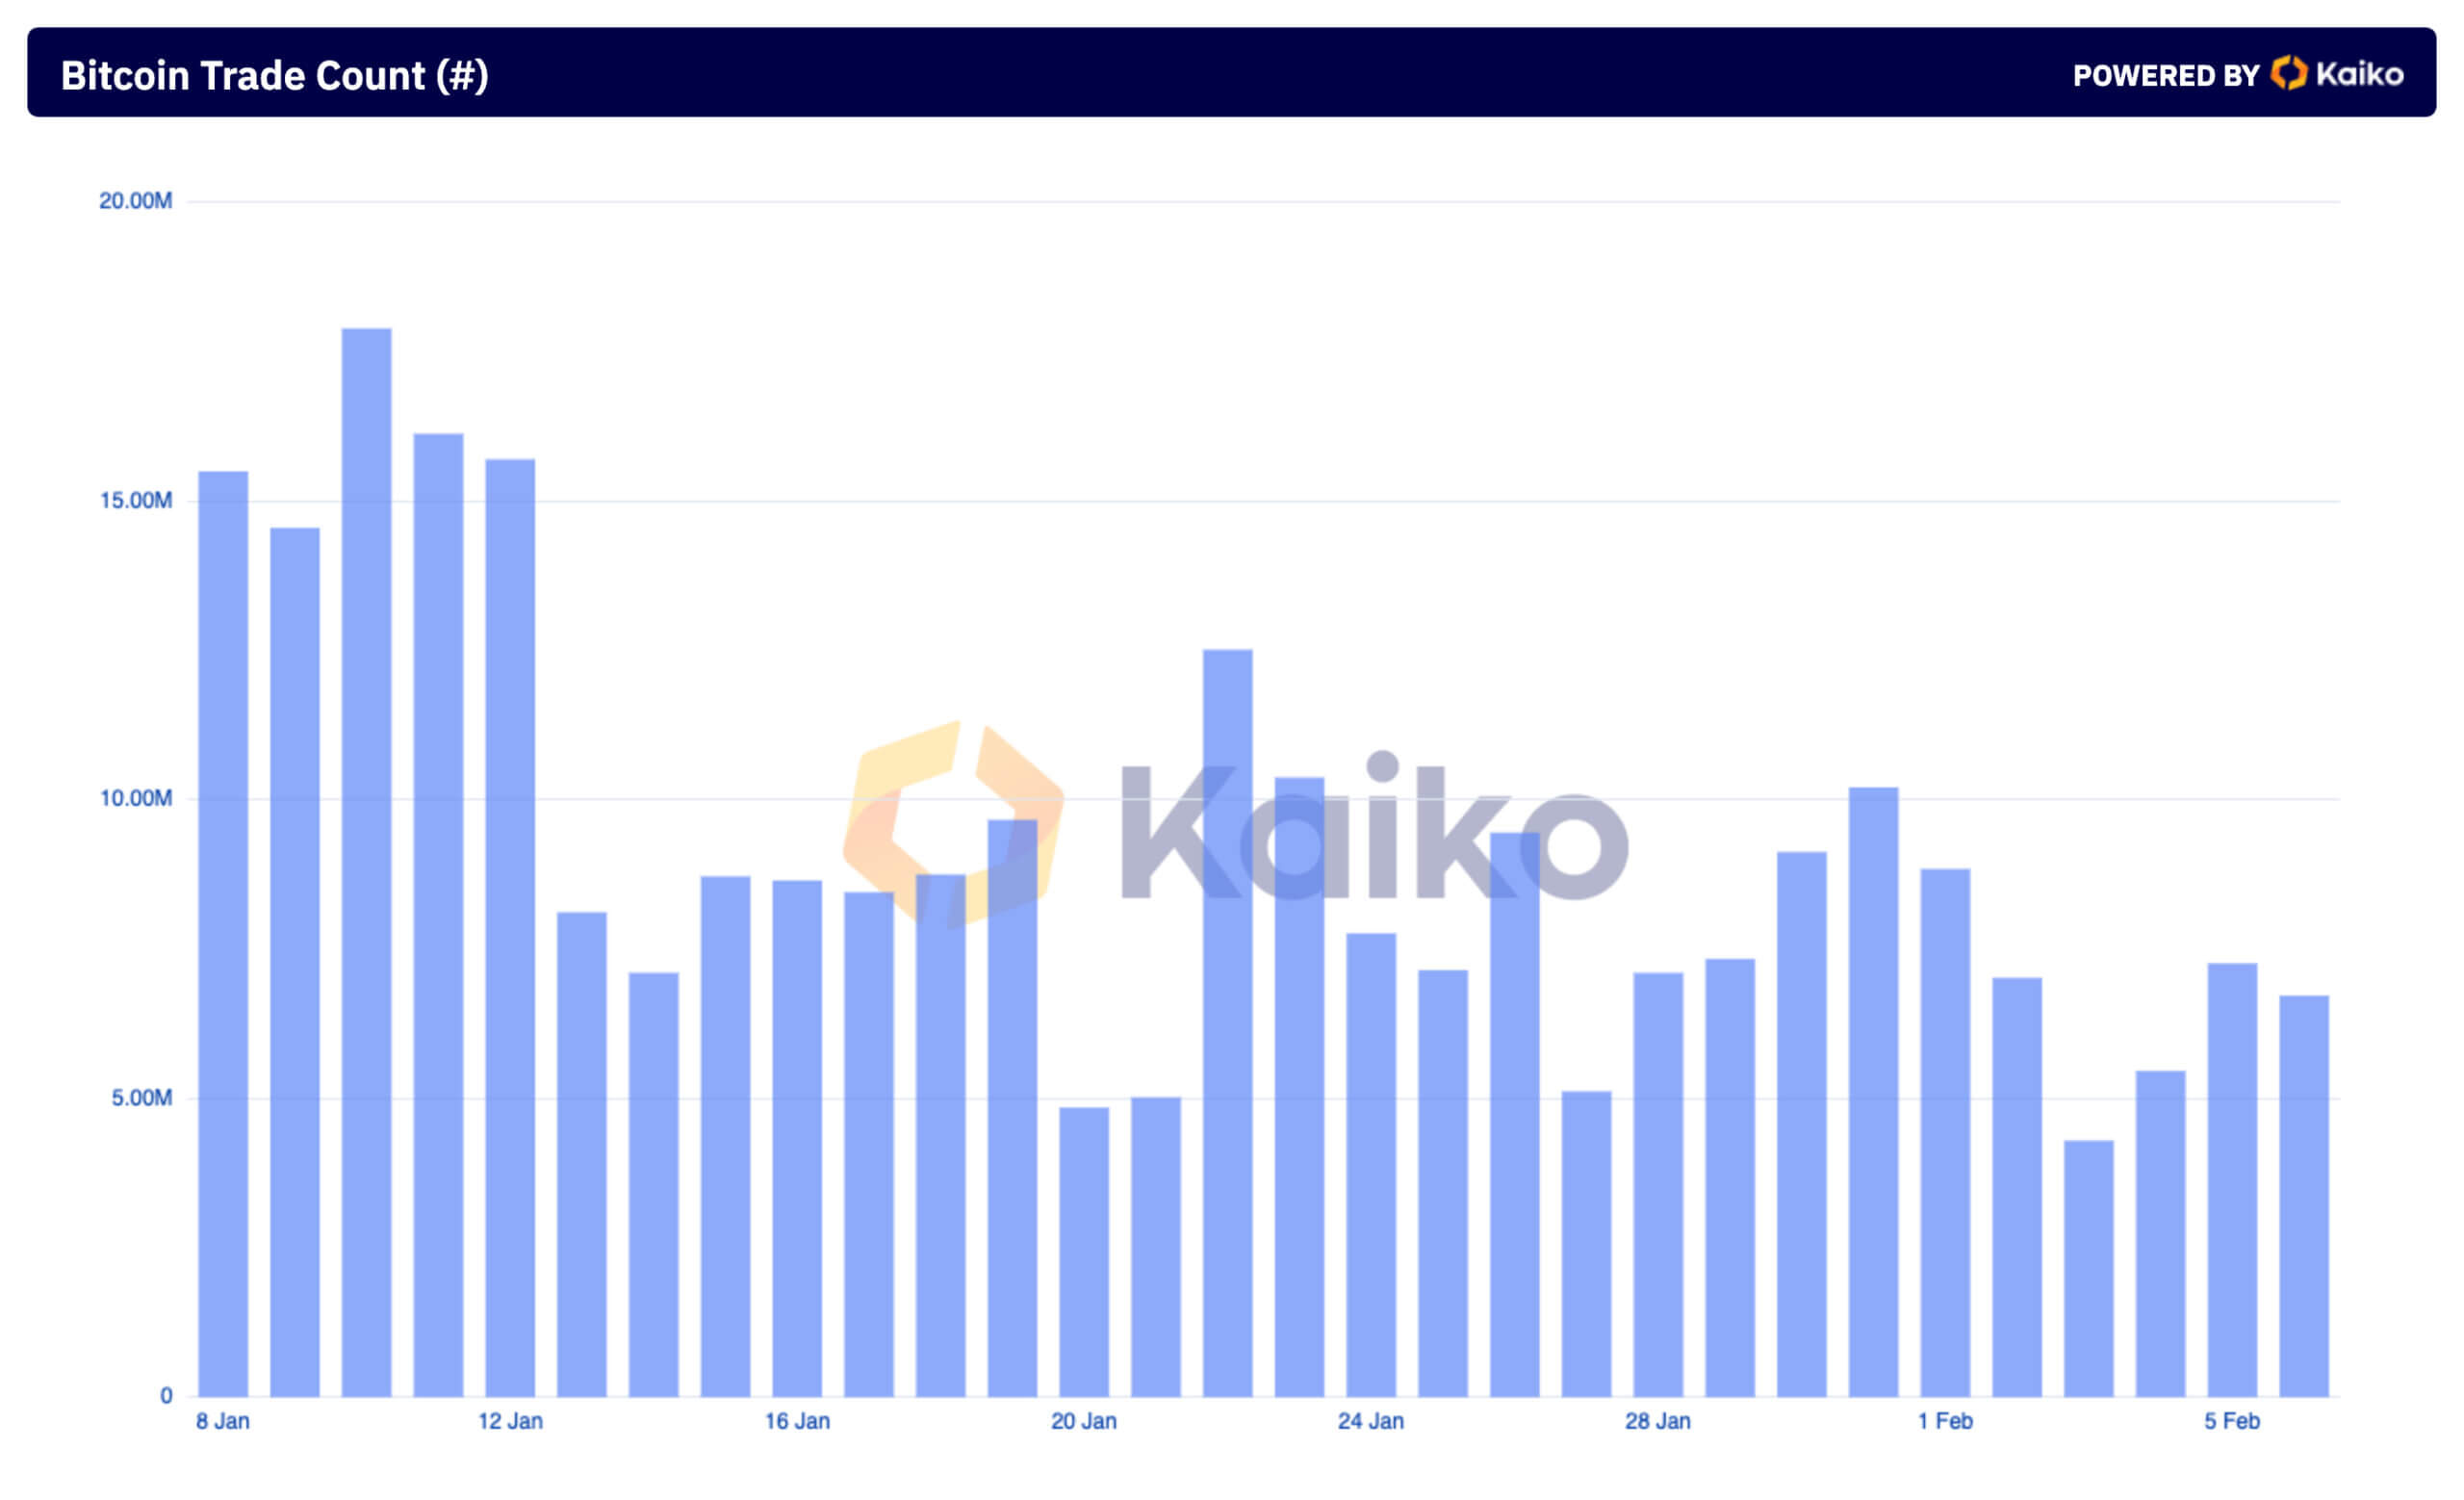
Following this initial surge, there was a noticeable decline both in trading volumes and counts throughout January, showing a normalization of market activity.
By Feb. 1, volumes decreased to $8.83 billion; by Feb. 3, they dropped to $3.82 billion. This decline could be attributed to the market’s adjustment after the ETF hype, settling into sustainable levels of trading activity. The fluctuations in trading volume continued throughout the month, with volumes peaking at $7.79 billion on Feb. 5 before declining to $6.72 billion by Feb. 6.
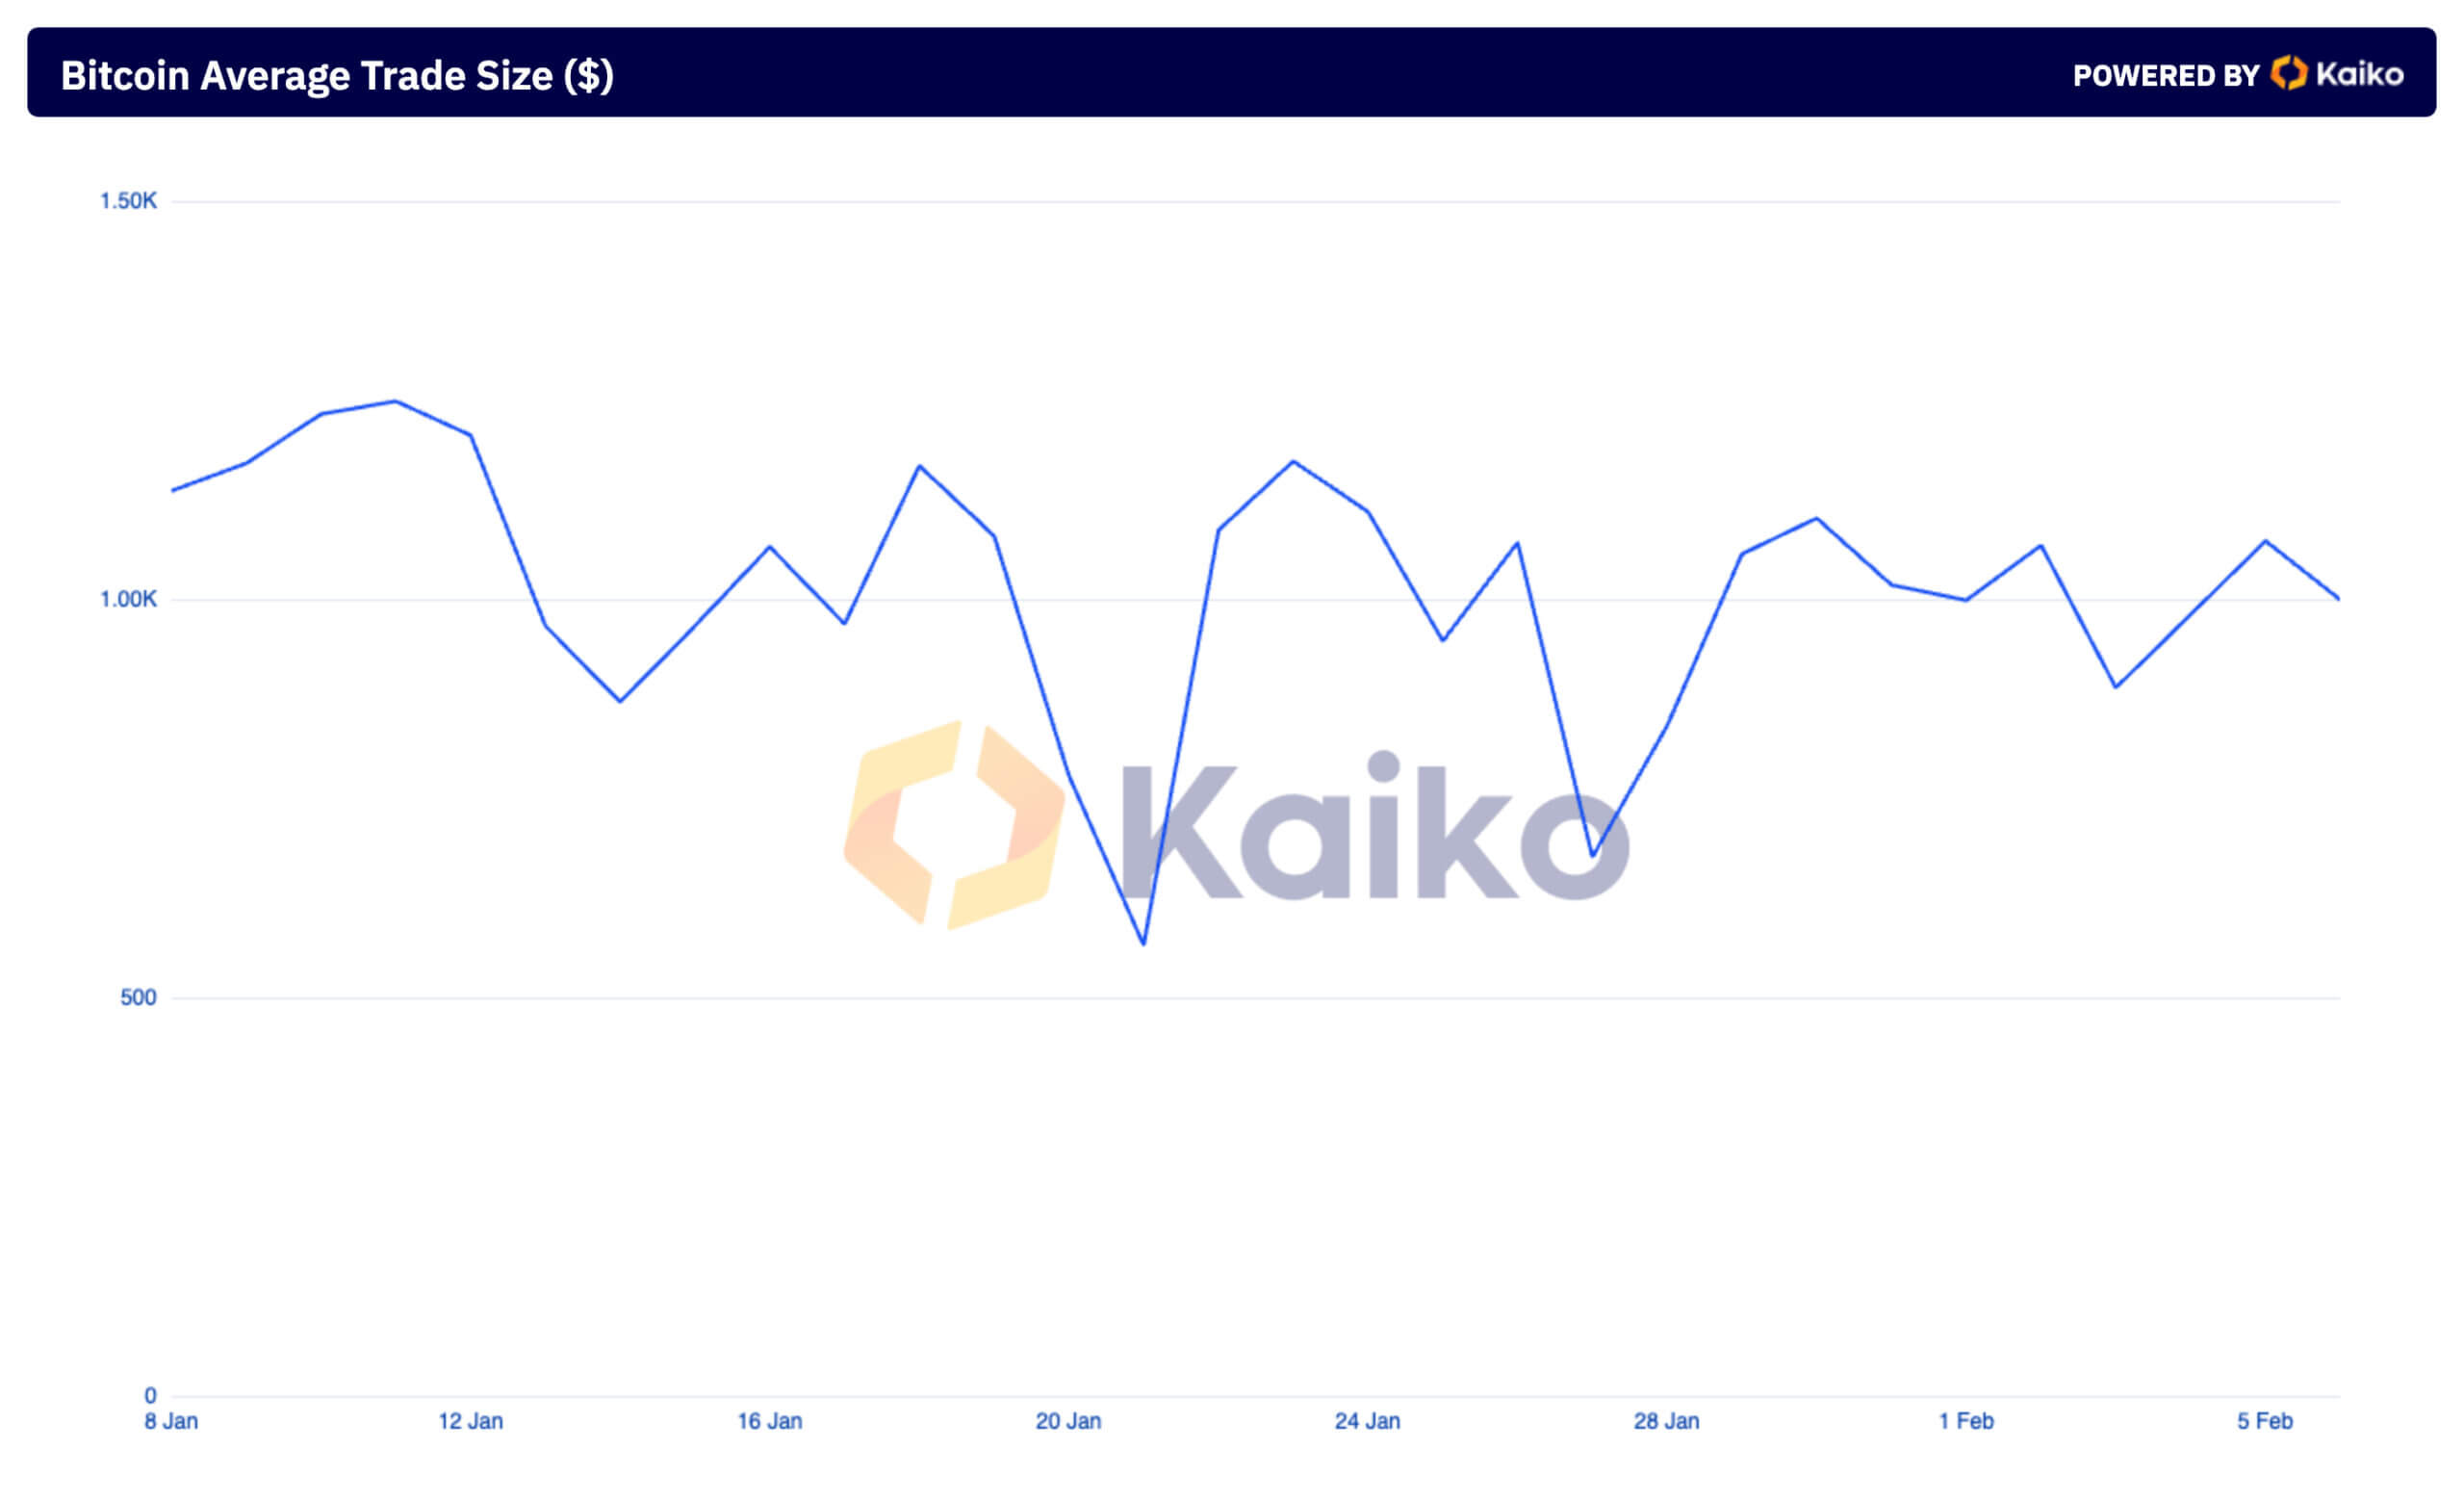
An interesting aspect of this period was the consistency of the average trade size, which remained stable at around $1,000 across exchanges, with only two drops below $871 in a month. This steadiness in trade size amidst fluctuating volumes and trade counts shows that while the number of transactions and total volume varied, the individual transaction size by traders remained relatively unchanged.
Analyzing market share distribution among exchanges reveals where most of the trading happens. Binance solidified its market dominance, increasing its share from 44.26% of the global trading volume on Jan. 10 to 61.85% on Feb. 6. This growth not only highlights Binance’s strong market position but also suggests a consolidation of trading activity around major platforms.
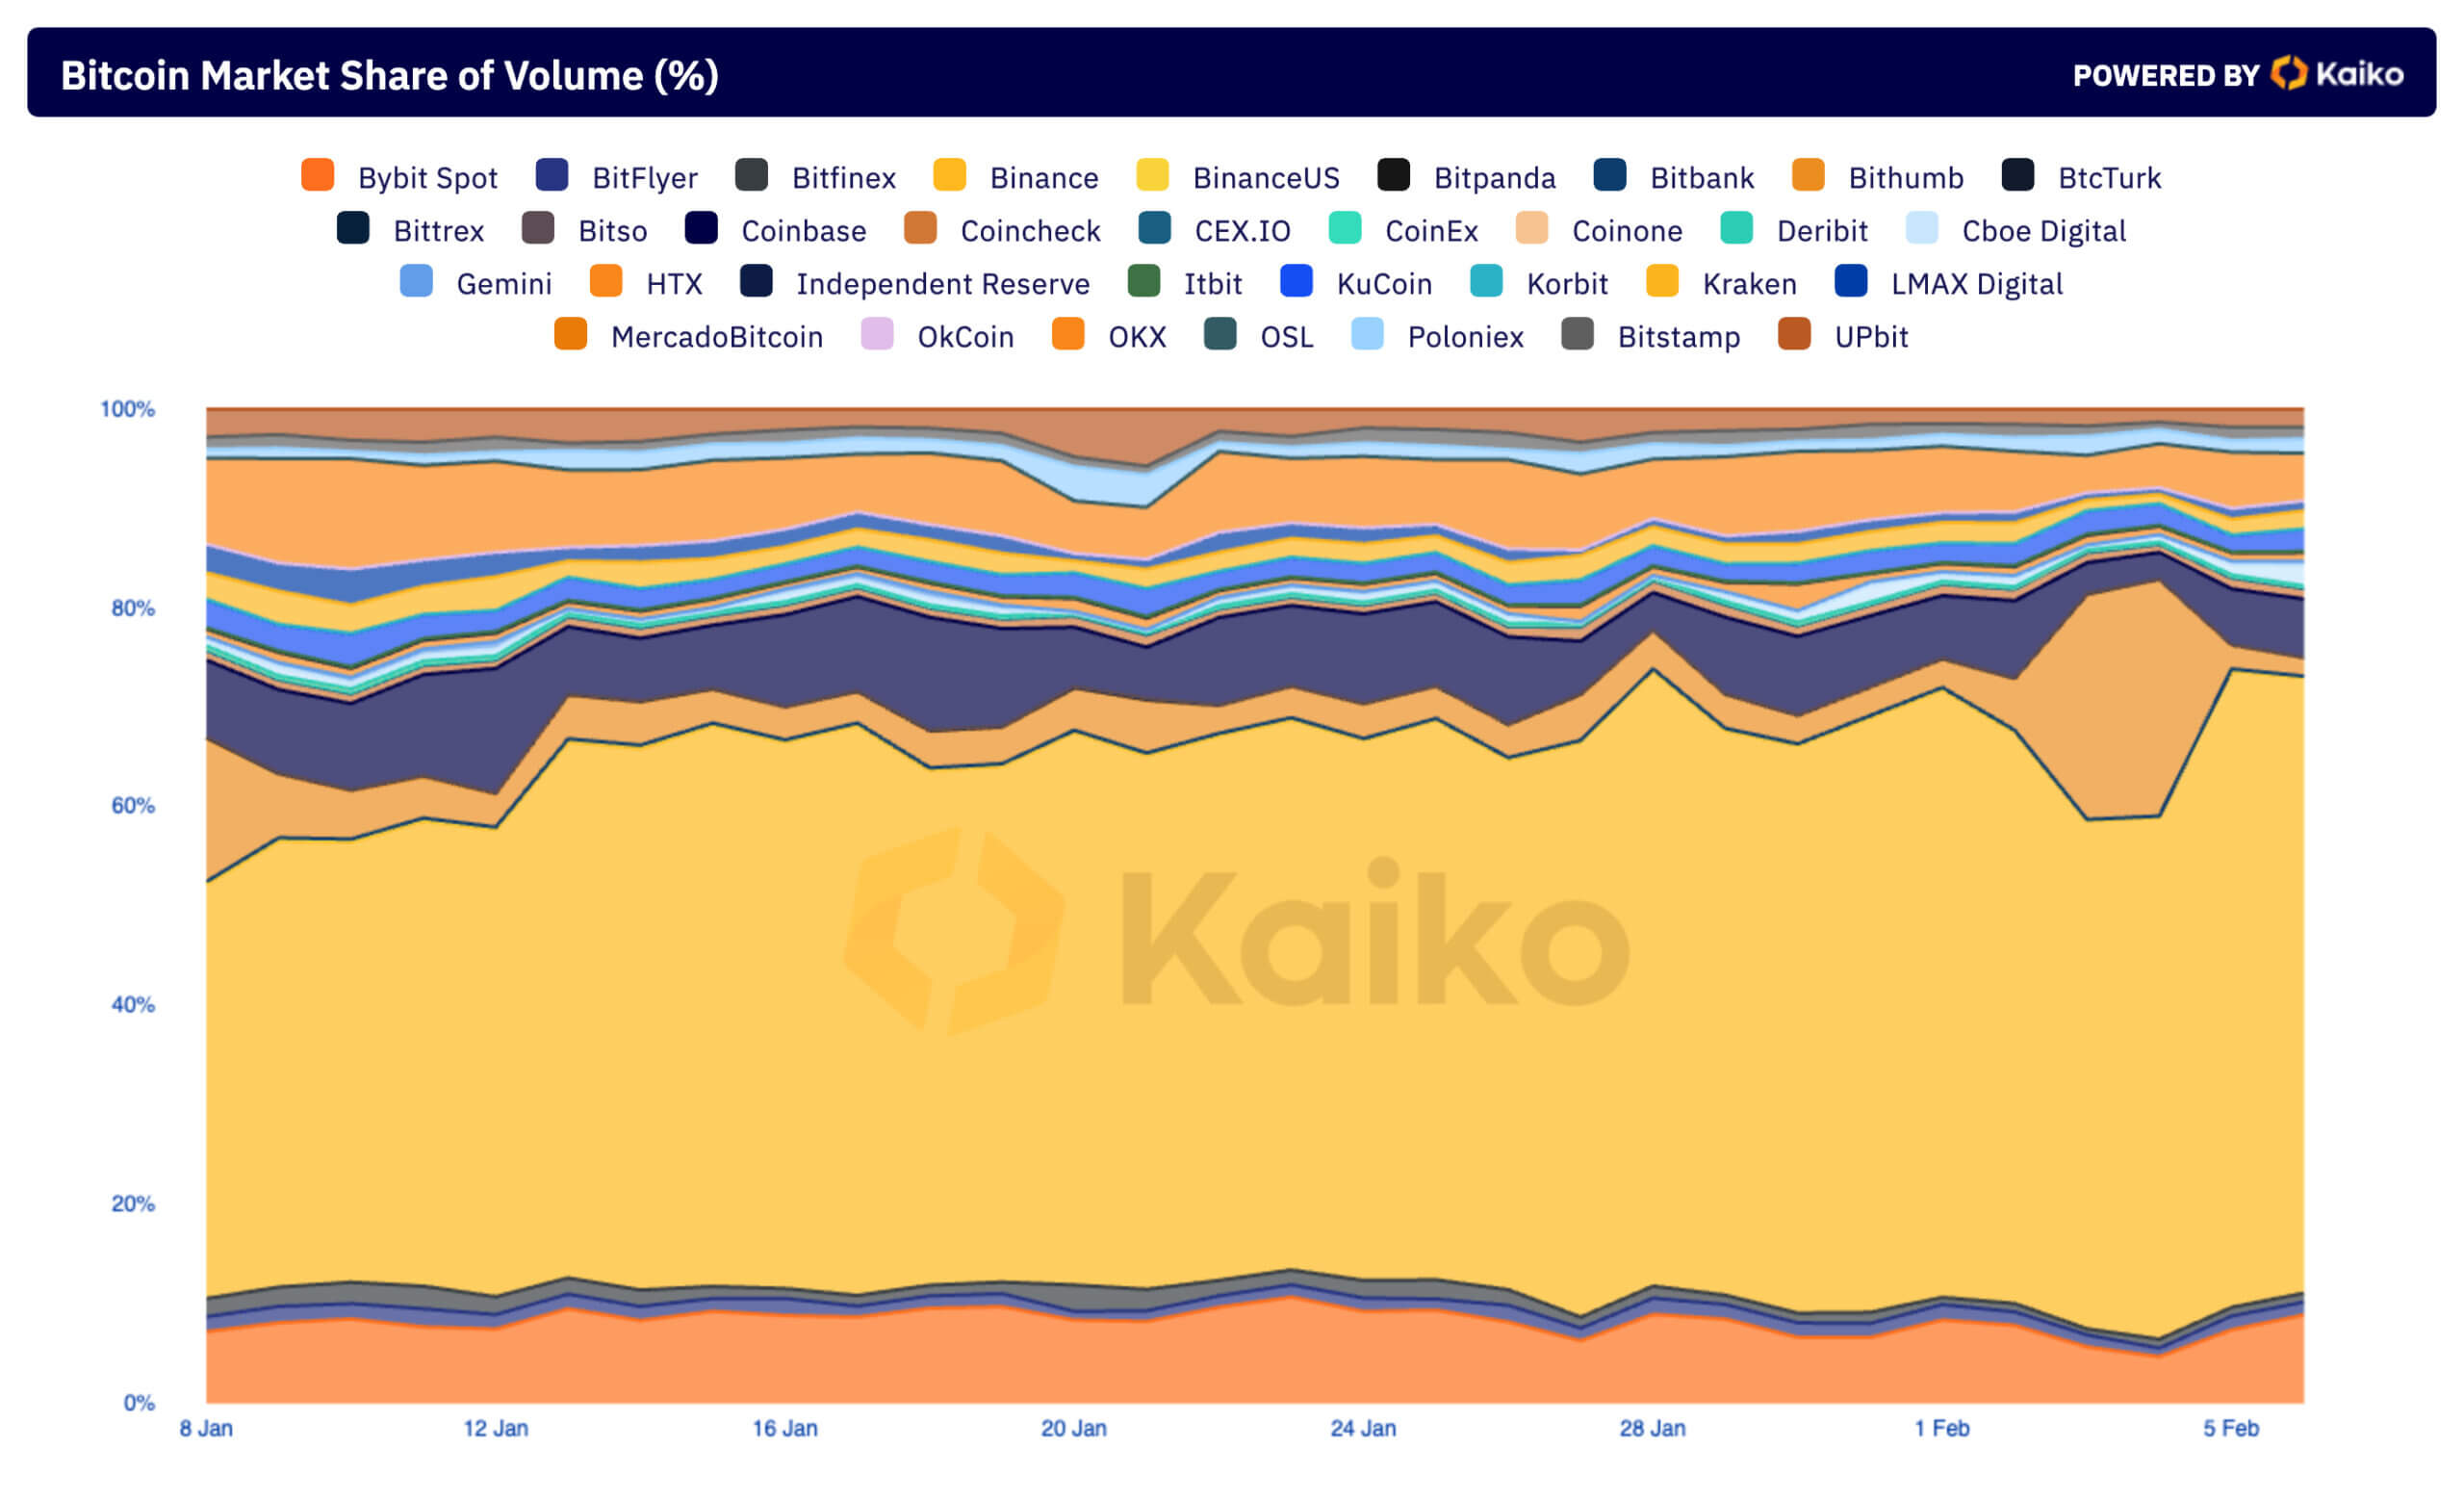
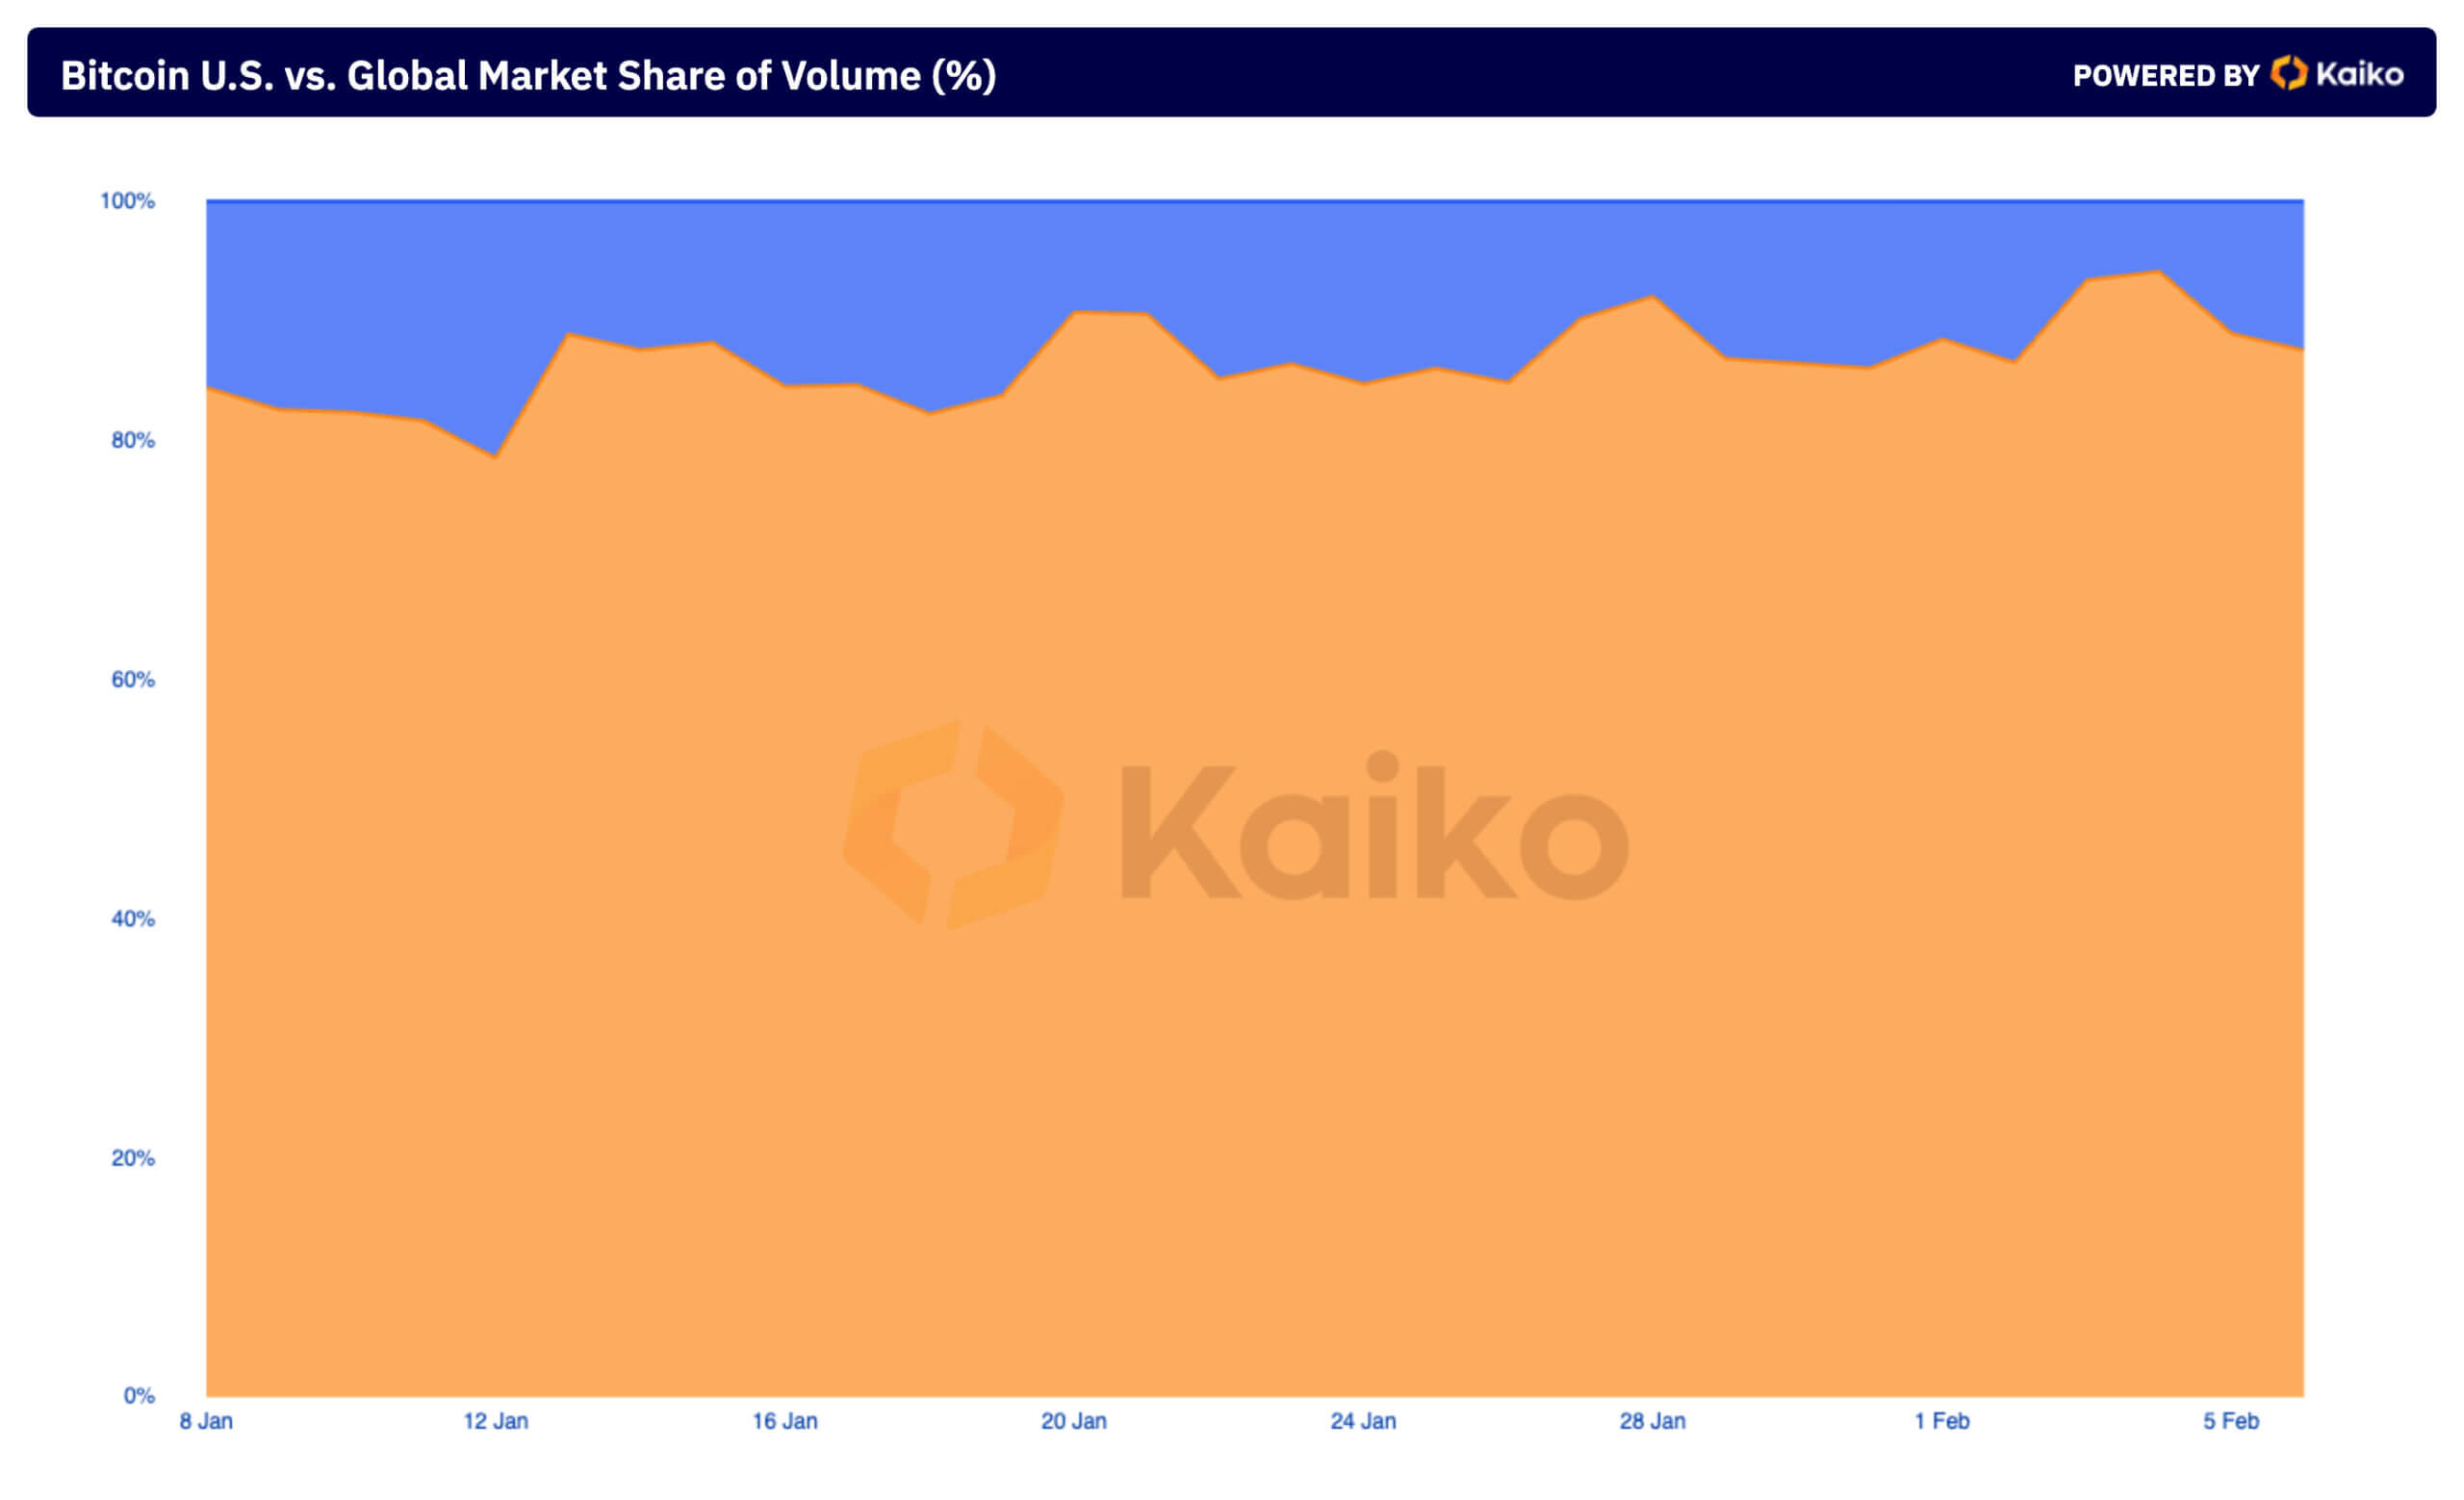
In contrast, Coinbase saw a decrease in its share of global trading volume following the launch of the ETFs, indicating that U.S. traders have been outpaced by a global audience trading on Binance.
The global distribution of Bitcoin trading volume further confirms this. Despite an initial increase in the U.S. market share, most trading activity continued to be dominated by the global market. This shows just how decentralized and borderless the Bitcoin market is, with the most significant volumes occurring outside of the U.S.
The post What Bitcoin’s trading patterns on centralized exchanges tell us about the market appeared first on CryptoSlate.


