Bitcoin’s realized cap is a nuanced and innovative metric for assessing the valuation of Bitcoin that differs significantly from traditional market capitalization.
Unlike the market cap, which simply multiplies the current market price of Bitcoin by the total number of coins in circulation, the realized cap offers a more granular and economically meaningful insight into the Bitcoin market.
It does this by aggregating the value of all Bitcoins at the price they were last moved rather than the current price. This approach can provide a more stable view of the market’s valuation, less prone to the volatility associated with speculative trading and short-term market movements.
To calculate the realized cap, one must take the value of each Bitcoin at the time it last moved and then sum these individual values across all Bitcoins. This means if a Bitcoin was last moved when its value was $10,000, that specific Bitcoin contributes $10,000 to the cap, regardless of the current market price.
The realized cap reveals things about the Bitcoin market that are not immediately apparent through the market cap.
Firstly, it can provide insights into the investment behavior of Bitcoin holders. For example, a rising realized cap suggests that Bitcoins are moving at higher prices, indicating positive sentiment among investors. Conversely, a stable or declining realized cap can signal that most Bitcoins are not changing hands, possibly implying holder conviction or a lack of new investment at higher price levels.
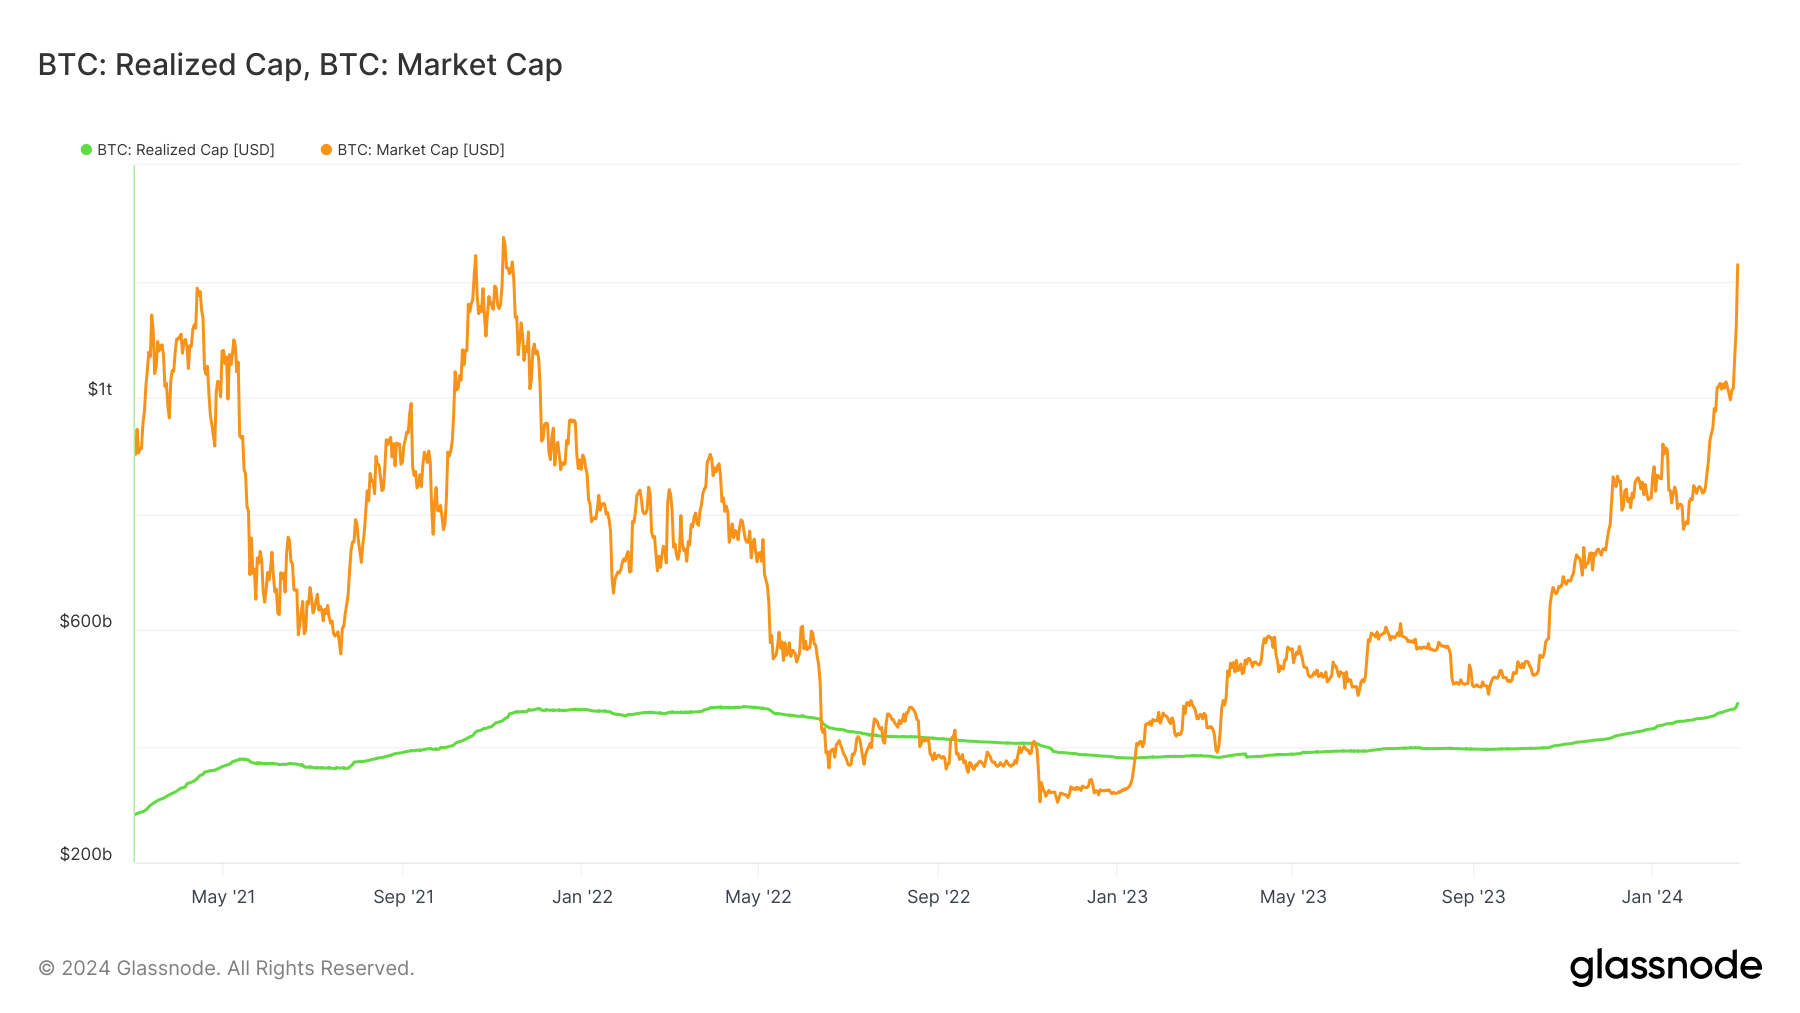
Moreover, it can serve as a proxy for the invested capital that is less sensitive to speculative swings. In periods of high volatility, the market cap can fluctuate wildly, but the realized cap tends to move more smoothly, as seen in the graph below, reflecting a more grounded assessment of the Bitcoin market’s worth. This stability makes it a valuable tool for investors looking to gauge the market’s underlying health beyond the noise of daily price movements.

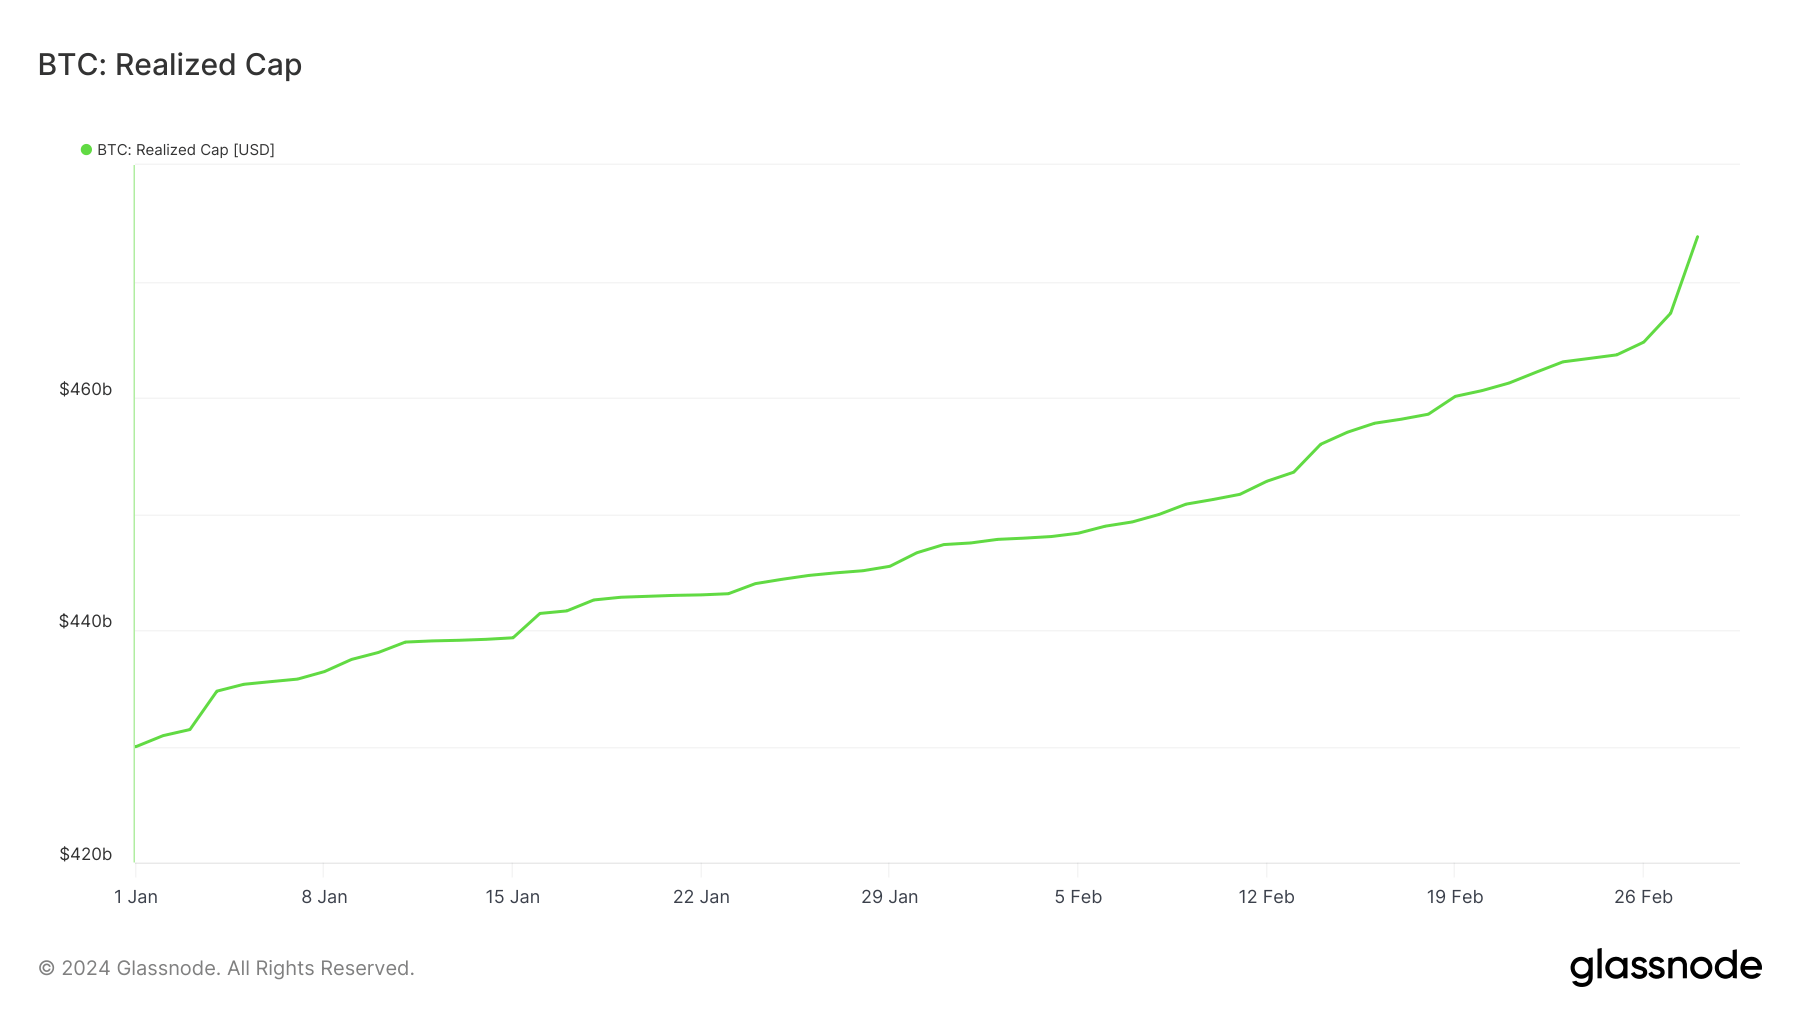
Bitcoin’s realized cap reached its all-time high on Feb. 28, topping at $473.8 billion. This signifies that, on average, the Bitcoin network and its participants have never been as economically invested in BTC as they are now, based on the prices at which most Bitcoins were last transacted.
Reaching an ATH in the realized cap indicates a broadening and deepening of the market’s foundation.
Unlike market cap, which can rapidly inflate with speculative fervor, the realized cap grows as a result of transactions that reflect actual transfers of wealth and, by extension, a more durable belief in Bitcoin’s value. Therefore, this ATH could be seen as a more meaningful indicator of Bitcoin’s increasing acceptance and integration into the financial portfolios of a wider array of investors.

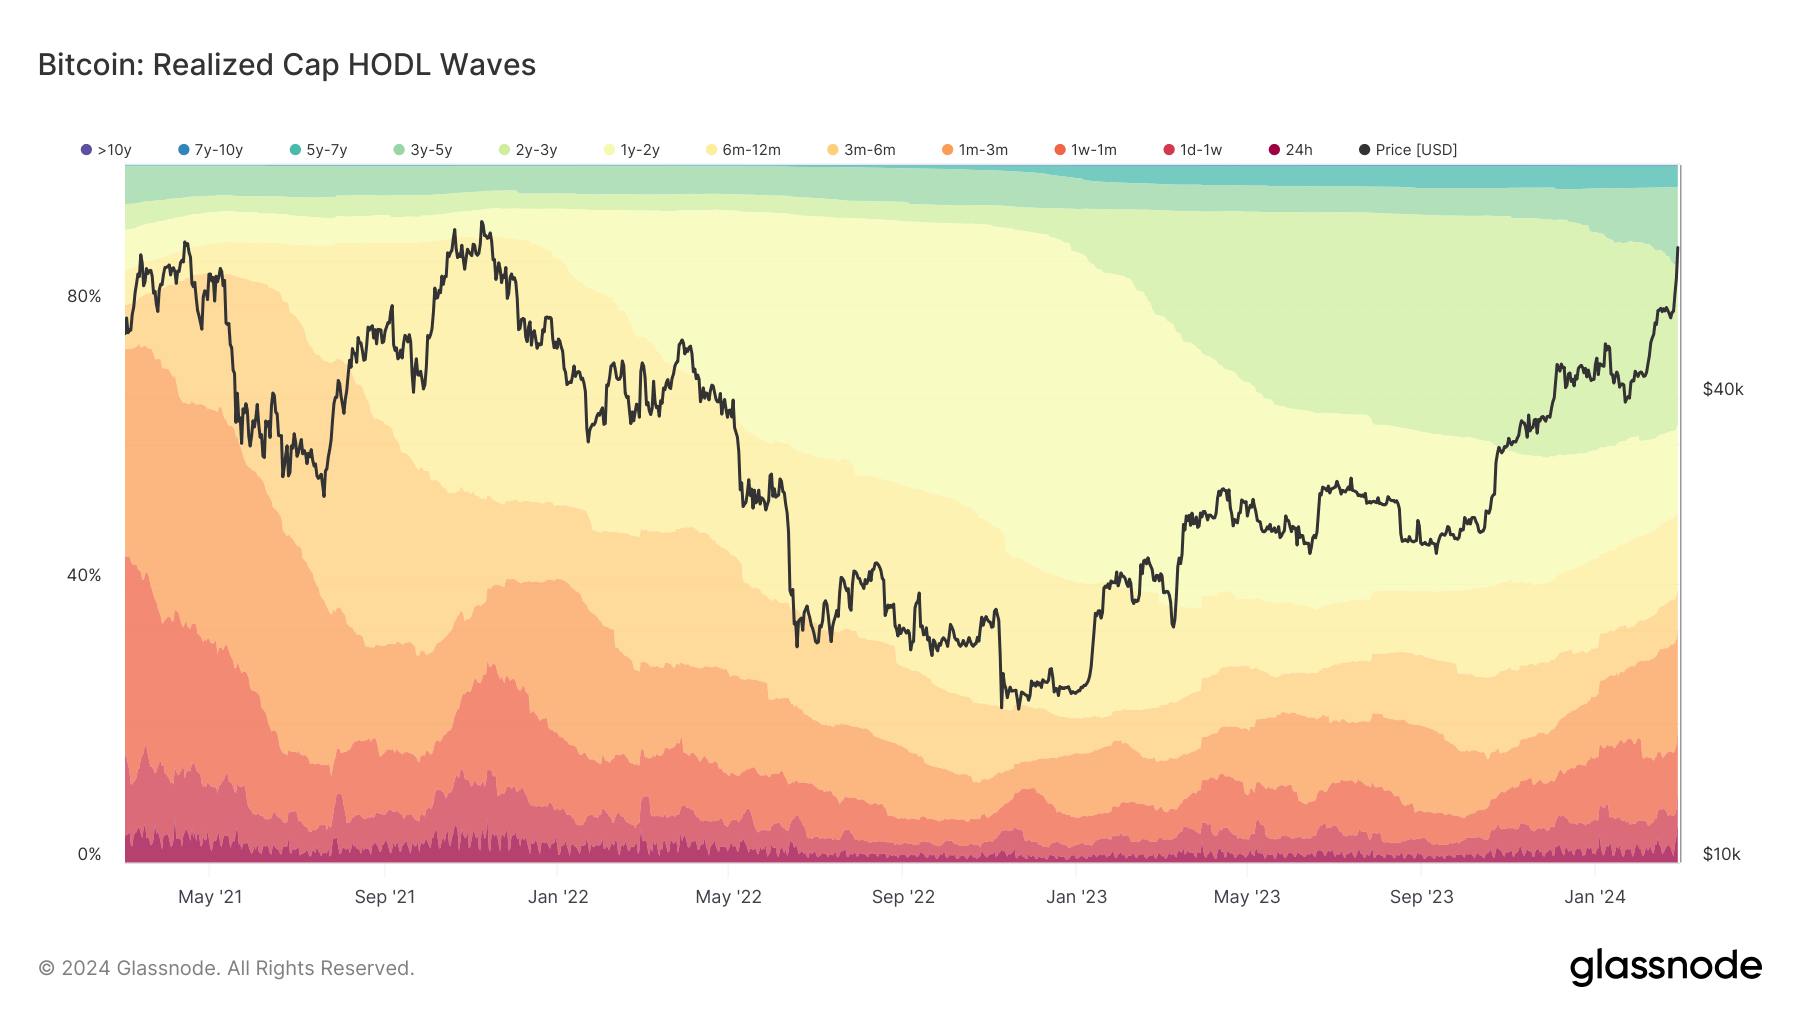
The Realized Cap HODL Waves data provides a fascinating insight into the behavior of Bitcoin holders and their contribution to the realized cap’s increase. By analyzing the changes in the distribution of Bitcoin holdings across different time-held cohorts in the past three days, we can determine which group is the most active and how their actions influenced the realized cap.
On Feb. 25, the distribution was as follows:
- Bitcoins held for less than 24 hours accounted for 0.856% of the realized cap.
- Bitcoins held between 1 day and 1 week contributed 5.8%.
- The 1-week to 1-month cohort represented 15.571%.
- Bitcoins held for 3 to 6 months made up 6.318%.
- The 6-month to 1-year group accounted for 11.818%.
- Finally, Bitcoins held for 1 to 2 years contributed 12.438%.
By Feb. 28, there was a notable shift:
- The share of Bitcoins held for less than 24 hours surged to 5.828%.
- Holdings between 1-day and 1-week dropped to 4.851%.
- The 1-week to 1-month cohort decreased significantly to 8.543%.
- The 3- to 6-month group was slightly reduced to 6.209%.
- The 6-month to 1-year holdings fell to 11.338%.
- The 1-year to 2-year cohort decreased to 11.975%.

From this data, the most significant shift occurred in the under-24-hour cohort, which dramatically increased from 0.856% to 5.828%. This suggests a substantial influx of new investment or trading activity, where a large volume of Bitcoin changed hands quickly and was likely sold or transferred at higher prices, contributing to the rise in the realized cap. Such short-term holding indicates speculative trading or immediate responses to market conditions.
The decrease in percentages for the 1-day to 1-week and 1-week to 1-month cohorts, alongside slight declines in the longer-term holding categories, suggests a consolidation or a shift from these groups into either the very short-term holding (<24h) due to trading or into longer-term holdings not specified here. This could indicate a reallocation of assets within the market, where some short to medium-term holders decided to take profits or reallocate their investments, contributing to the realized cap increase.
Therefore, the rise in the realized cap appears to be significantly influenced by short-term market activity and trading rather than long-term holding strategies, as evidenced by the dramatic increase in the <24h cohort. While there is activity across all cohorts, the predominant contribution to the realized cap’s rise in this period comes from those engaging in short-term trading.
This behavior reflects a market where price movements and immediate trading opportunities influence the realized cap more than the accumulation strategies of longer-term investors.
The post Record high realized cap shows unprecedented economic investment in Bitcoin appeared first on CryptoSlate.


