TL;DR
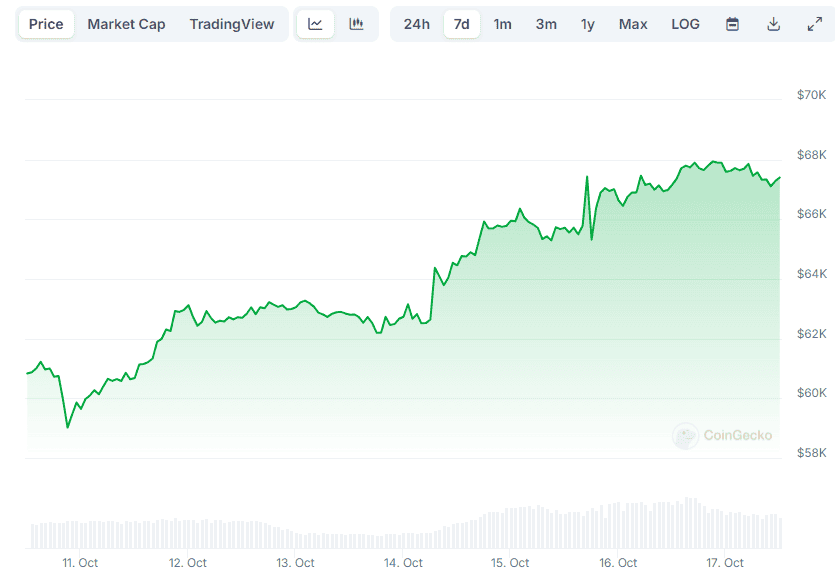
- Bitcoin soared to around $67,400, with some metrics suggesting potential for further gains.
- However, some bearish signals, such as an overvalued MVRV ratio and overbought RSI, indicate a possible price pullback.
BTC Price Explosion Incoming?
The price of the leading cryptocurrency surged by over eight grand in the past week, currently trading at around $67,400 (per CoinGecko’s data). The rally fueled huge enthusiasm among BTC proponents, many of whom assumed that “Uptober” was finally here.

Some important indicators signal that the asset has yet to witness substantial gains. One example is the BTC supply stored on exchanges, which, according to X user Ali Martinez, has tumbled to a five-year low.
Such a development is generally considered bullish since it suggests that holders might be shifting from centralized platforms to self-custody methods (which reduces the immediate selling pressure). Moreover, fundamental economic principles dictate that BTC’s price should head north if demand remains constant or increases while the available supply drops.
A metric hinting that BTC could be ahead of a more volatile period is the growing Open Interest. As CryptoPotato reported on October 15, the figure reached an all-time high of $19.8 billion. It kept rising in the following hours, surpassing $20 billion on October 16 (per CryptoQuant’s data).
The rise of OI is combined with BTC funding rates that have hit their highest positive levels in the past two months. This indicates that most of the open interest is comprised of long positions, which, combined with the growing demand reported by CryptoQuant’s CEO, reaffirms the narrative about a potential rally.
Some Bearish Factors
Contrary to the aforementioned indicators suggesting that the primary cryptocurrency could experience another bullish momentum soon, some hint at the opposite scenario.
BTC’s MVRV (Market Value to Realized Value), for instance, has been gradually increasing in the past week, crossing the critical ratio of 2. Readings above that mark typically show that the asset could be overvalued and poised for a pullback.
The Relative Strength Index (RSI) is next on the list. This technical analysis tool measures the speed and change of price movements and is commonly used to identify overbought or oversold conditions. When the ratio is above 70, it indicates that BTC is in overbought territory, meaning a correction could be imminent. The RSI has been hovering above that level in the past three days.
The post This Declining Major Bitcoin Metric Hints at Upcoming BTC Bull Run: Details appeared first on CryptoPotato.


