Ripple’s price has been bearish over the last few weeks as it failed to continue its upward momentum. However, the momentum during the past few days has been quite tumultuous, resulting in a choppy price action that puts the trend into question.
Bitcoin Price Analysis: Technicals
Technical Analysis
By Edris Derakhshi (TradingRage)
The Daily Chart
The daily chart shows that the price has been making higher highs and lows since rebounding from the $52K support level in September. The 200-day moving average, located around the $64K level, has also been broken to the upside.
Yet, the market has not been successful in rising above the key $69K resistance level and is currently correcting lower. Therefore, a retest of the 200-day moving average would be probable in the coming days. Still, if BTC trades above $60K, the trend could be considered bullish.
The 4-Hour Chart
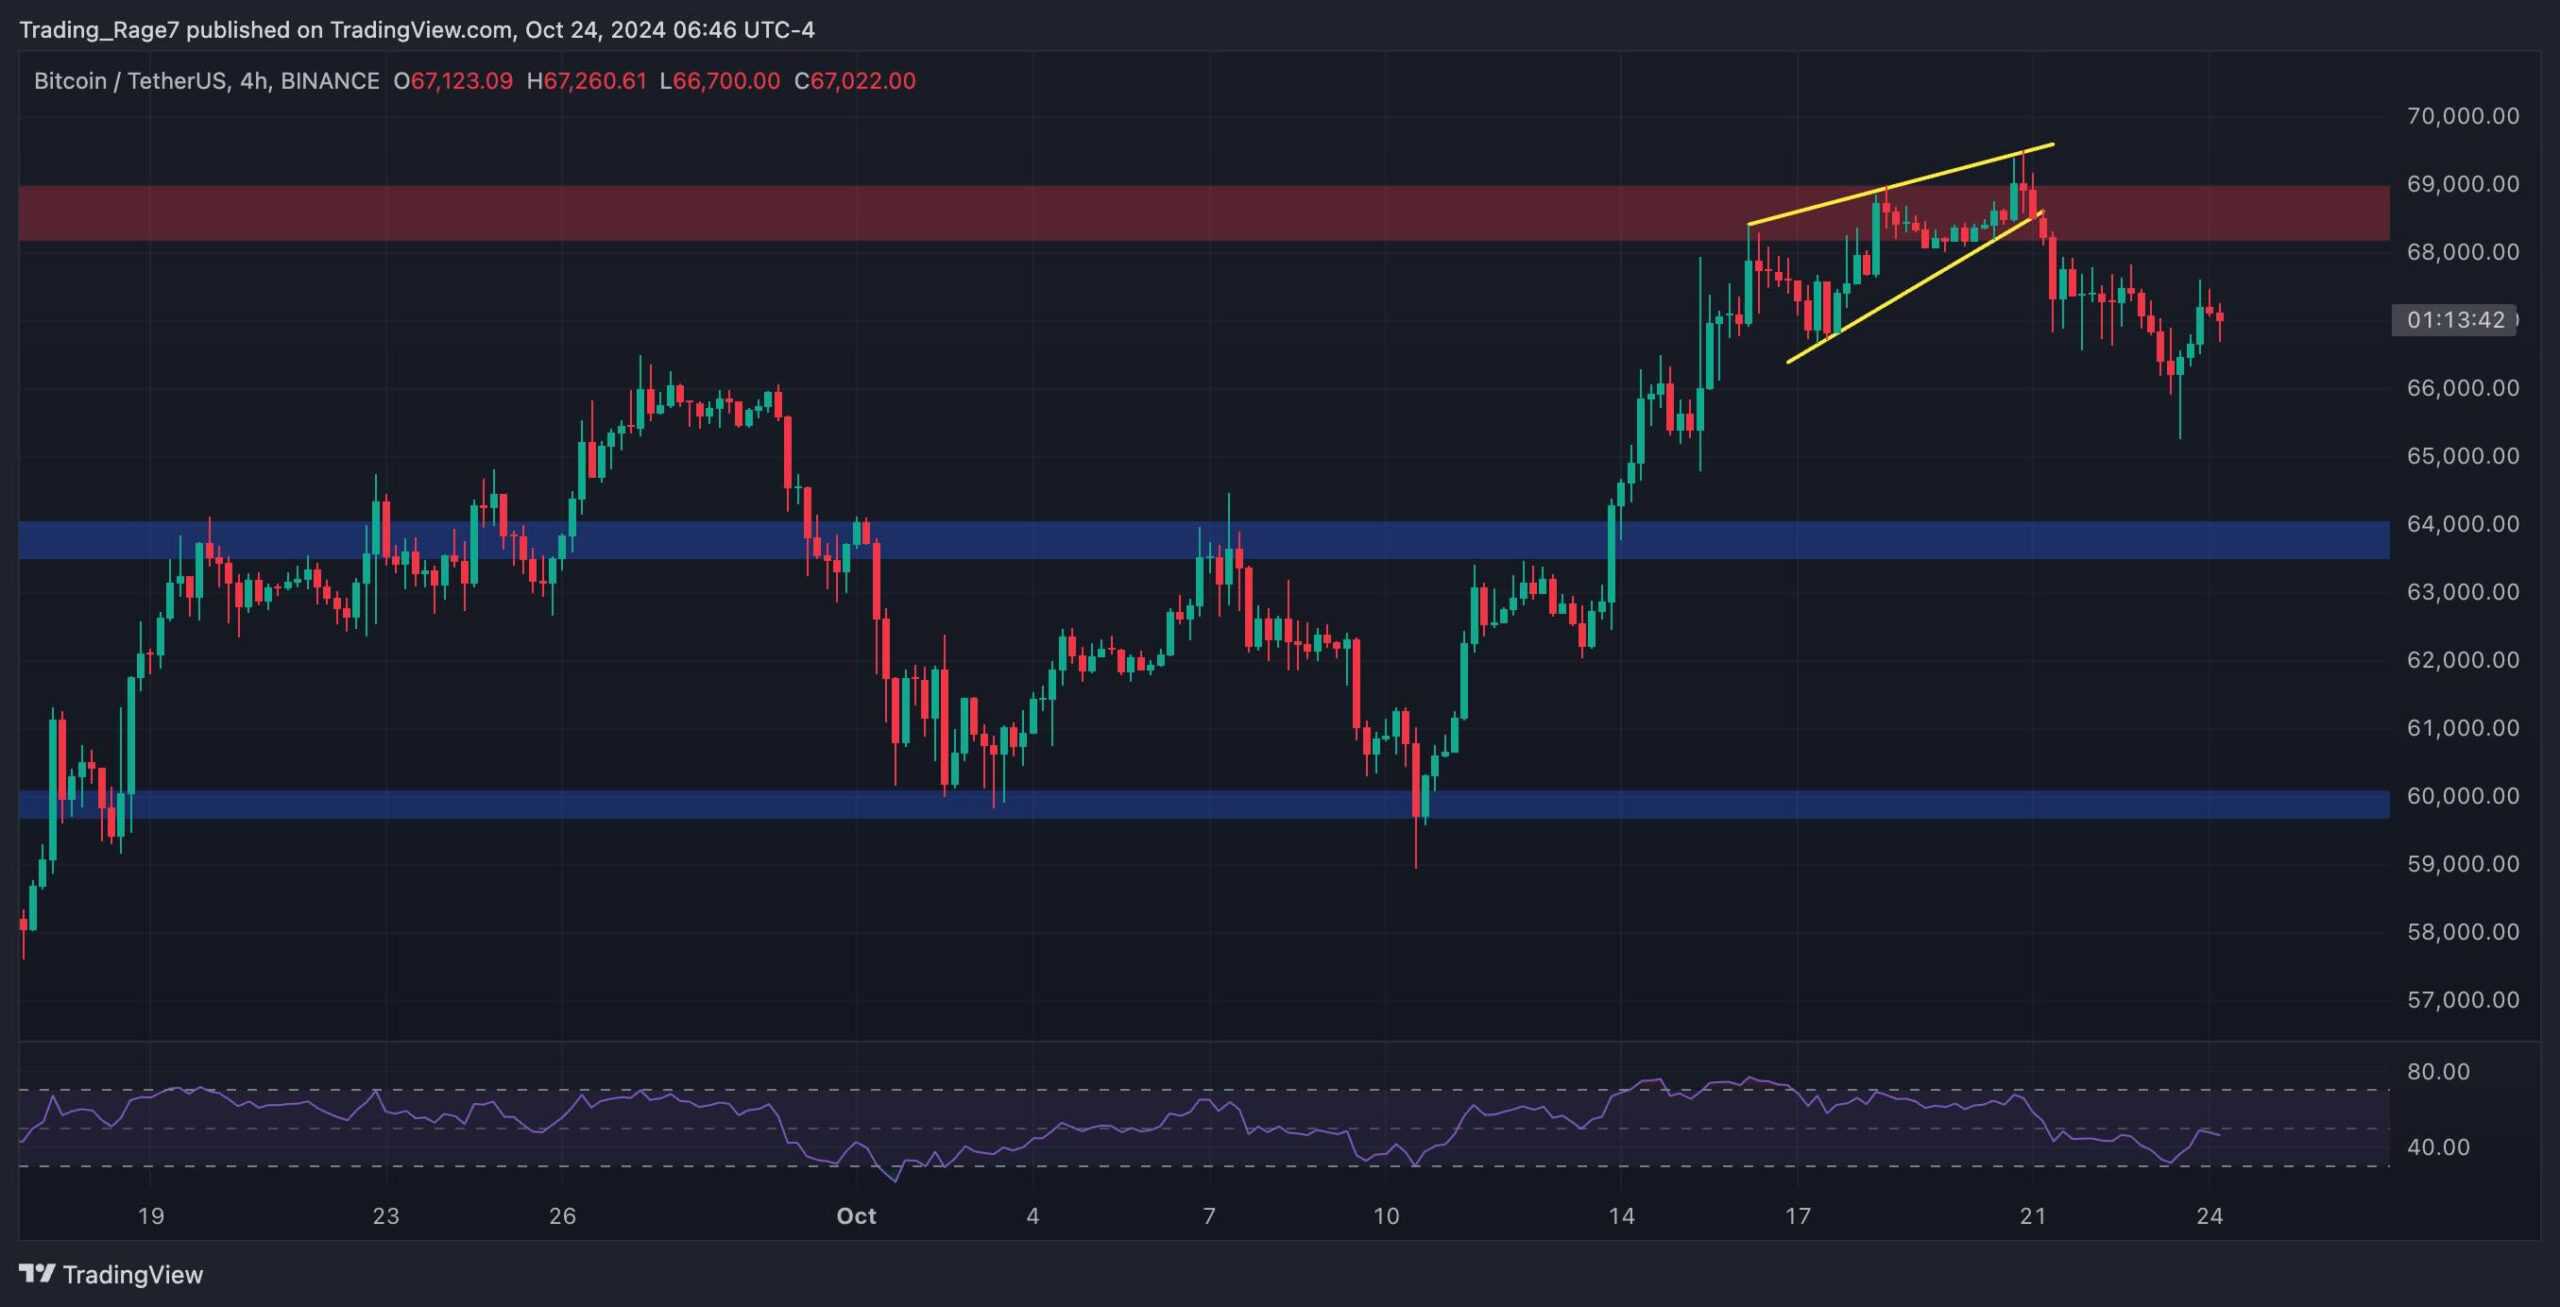
Looking at the 4-hour chart, the price has broken a rising wedge pattern to the downside while getting rejected from the $69K resistance zone. The RSI has also dropped below 50%, as the 4-hour momentum has shifted bearish.
Yet, even though $64K seems like a probable target, a drop toward it might not materialize, as a recovery and continuation could begin much sooner. If true, this behavior would confirm that a strong rally is starting for Bitcoin, and it would only be a matter of time before a new record high.

On-Chain Analysis
By Edris Derakhshi (TradingRage)
Bitcoin Exchange Reserve
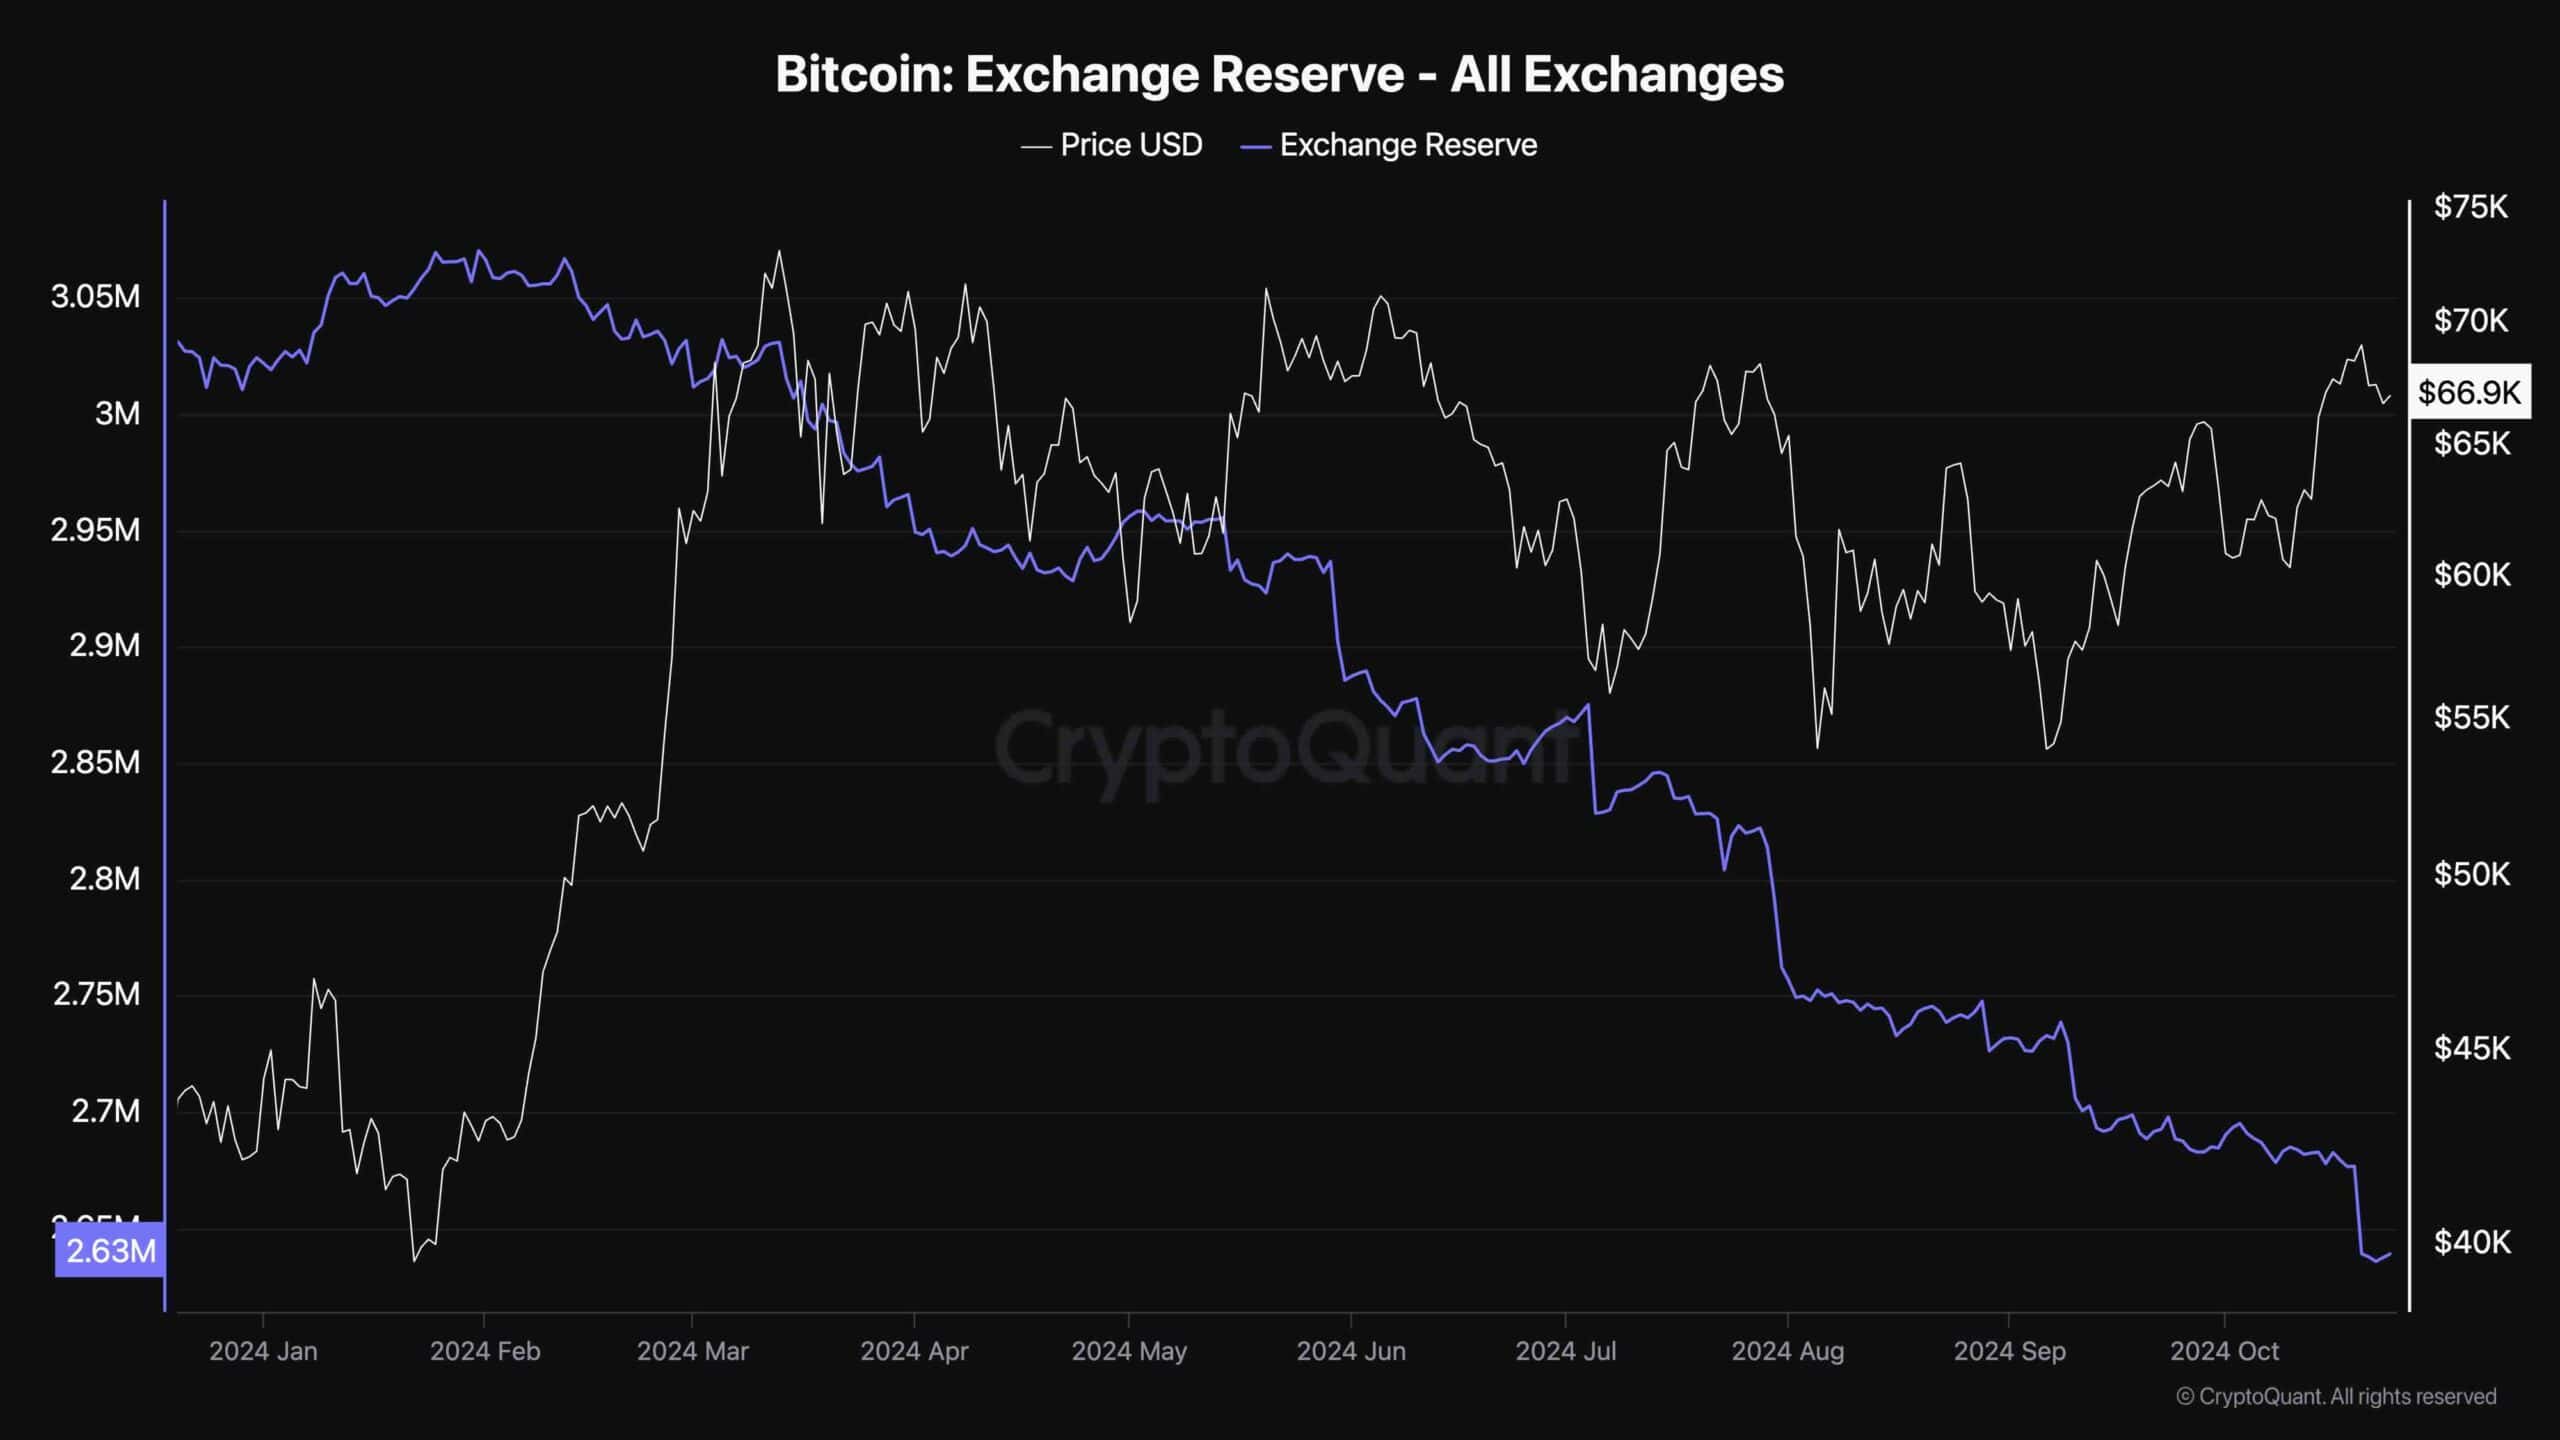
As BTC approaches a new all-time high, market participants are wondering whether the large investors are taking profits or still accumulating. Based on this data, the latter seems true.
This chart demonstrates the exchange reserve metric, which measures the amount of BTC held in exchange wallets. It is widely regarded as a proxy for supply because the coins kept in exchanges can be quickly sold, pushing the price lower.
As the chart suggests, the BTC exchange reserve has taken a nosedive recently, continuing its long-term decline. This clearly indicates an accumulation period, which could soon lead to supply shock and price surge, especially if the demand increases.

The post Bitcoin Price Analysis: Here’s the Most Probable Target for BTC in the Next Few Days appeared first on CryptoPotato.


