
Key Insights
- ETH declined 45% QoQ in Q1’25, falling from $3,300 to $1,800, underperforming BTC. Spot Ethereum ETF AUM decreased 48% in USD terms, though ETH-denominated holdings only dropped 3%, with BlackRock’s ETHA and VanEck’s ETHV gaining market share.
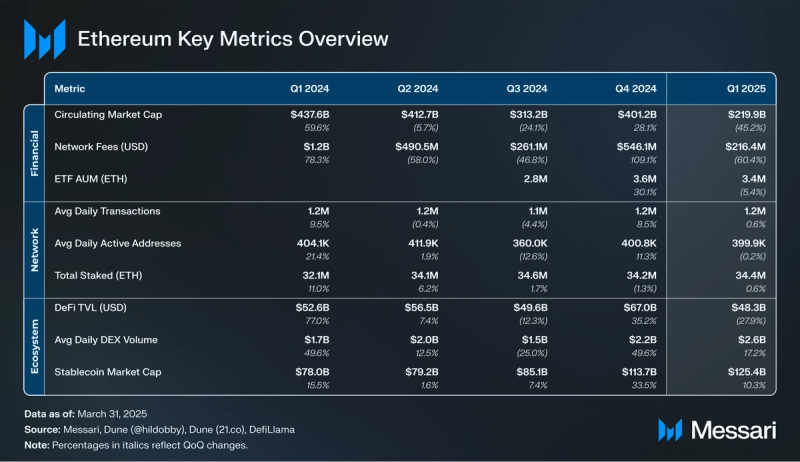
- Ethereum network fees fell 59% QoQ to $216.4 million, marking multi-year lows. This drop pushed ETH into inflationary territory with an annualized inflation rate of 0.6%.
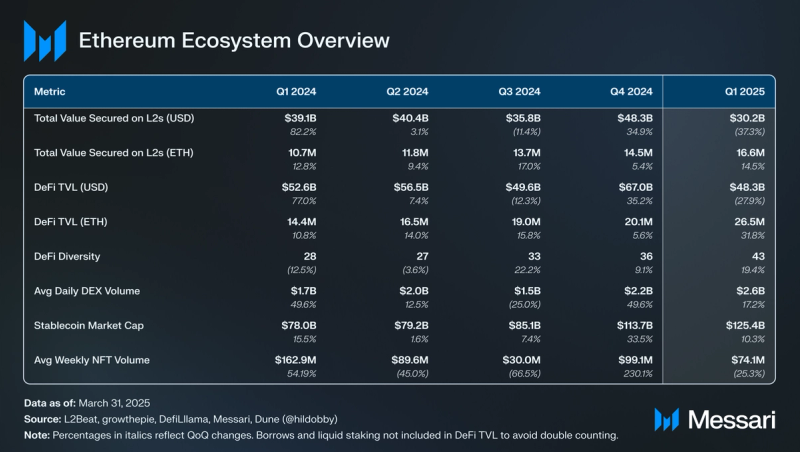
- Despite price headwinds, ETH-denominated DeFi TVL rose 32% QoQ to 26.5 million ETH. USD-denominated TVL fell 28%, but Ethereum still accounted for 56% of all DeFi TVL and ranked #1 by network.
- The Pectra upgrade, implemented post-Q1, introduced major improvements to Ethereum’s modularity and scalability, including EIP-7702 (account abstraction), EIP-7251 (increased validator limits), and expanded blobspace for rollup data.
Primer
Ethereum (ETH) is a distributed blockchain computing platform for smart contracts and decentralized applications. Ethereum’s smart contracts have enabled the creation of various new assets and industries, such as Decentralized Finance (DeFi), Non-Fungible Tokens (NFTs), Decentralized Autonomous Organizations (DAOs), and more. It features an execution engine optimized for smart contract processing, the Ethereum Virtual Machine (EVM).
Ethereum utilizes a Proof-of-Stake (PoS) consensus mechanism where users can run validators to secure the network and participate in block production. Users who meet the hardware requirements to run the latest execution and consensus clients and deposit 32 ETH into the Beacon Deposit Contract can permissionlessly operate an Ethereum validator.
Ethereum has chosen a scaling strategy using a network of Layer-2 networks to meet the growing demand for blockspace. Through this strategy, Ethereum plans to scale while maintaining a high degree of decentralization. These protocols rely on Ethereum security while solely focusing on transaction execution. Ethereum underwent the Dencun upgrade in Q1 2024 which introduced “blobs” for data storage, which significantly reduced Layer-2 transaction fees. The next major upgrade was Pectra, which went live in May 2025 and introduced EIPs that improve staking efficiency and L2 scalability.
Key Metrics
Financial Overview
Market Cap and ETFs
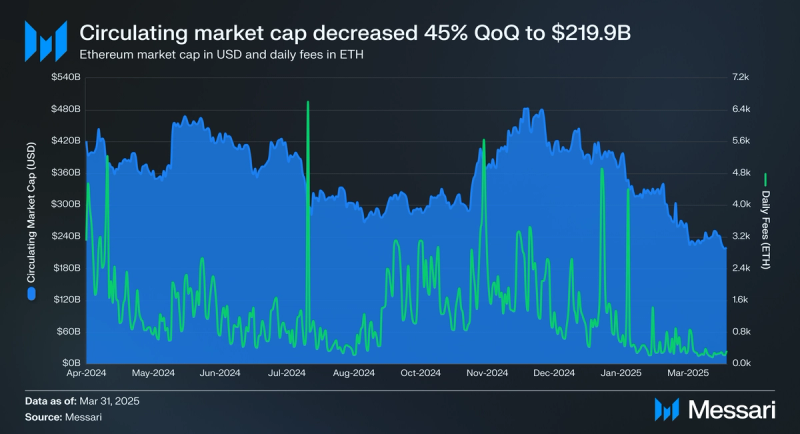
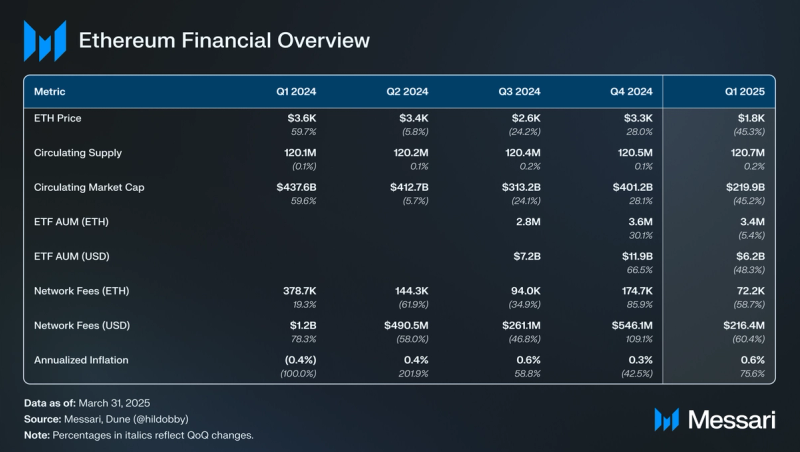
After a bullish Q4’24, ETH experienced a sharp downturn in Q1’25. ETH ended the quarter at $1,800, down 45% QoQ from $3,300 in Q4. ETH broke below $2,000 for the first time since Q4’23 in early March due to macroeconomic concerns from U.S. President Donald Trump’s tariff plans. Notably, however, the adverse effects of tariffs were not exclusive to ETH, as other risk assets such as U.S. equities experienced bearish price action during the same time period. Comparatively, ETH underperformed relative to BTC, which was only down 12% QoQ in Q1 (from $93,400 in Q4 to $82,500 in Q1).
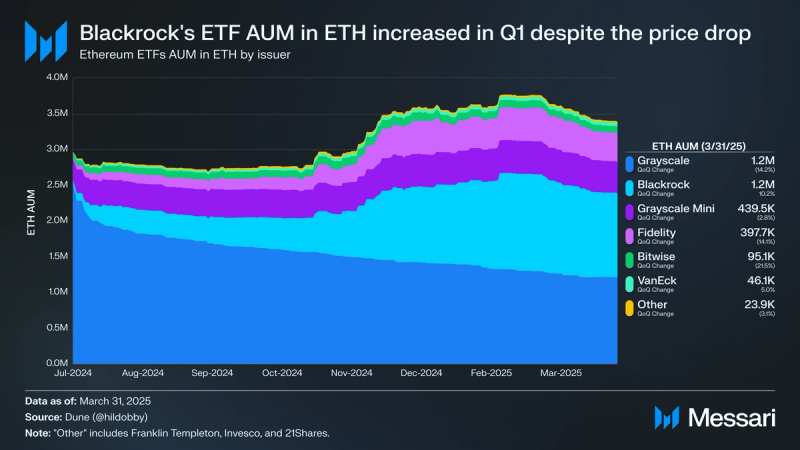
Spot Ethereum ETFs also saw outflows in Q1 due to the bearish price action. Spot Ethereum ETF Assets Under Management (AUM) in ETH decreased 3% QoQ from 3.6 million to 3.4 million ETH. Since the ETFs went live in July 2024, AUM in ETH has increased by 14% from 3.0 million. As for AUM in USD, it decreased by 48% QoQ from $11.94 billion to $6.18 billion. Over half of all AUM is held by Grayscale’s ETHE (36% of AUM) and BlackRock’s ETHA (35% of AUM). ETHE’s ETH holdings decreased 14% QoQ to 1.2 million, while ETHA’s ETH holdings increased 10% QoQ to 1.2 million. Combined, the two ETFs represent 71% of AUM (up 2% QoQ). Another notable spot Ethereum ETF with an increase in ETH AUM in Q1 was VanEck’s ETHV, which increased 5% QoQ to 46,100 ETH.
Supply Dynamics and Fees
The circulating supply of ETH is dynamically adjusted:
- Issuance – Ethereum mints new ETH tokens, otherwise known as the “base reward.” This reward is dynamic and is a function of the total amount of ETH staked and attesting validators.
- Burn – On Aug. 5, 2021, the ”London” hard fork went live, adding EIP-1559. This network upgrade activated a fee burn mechanism that burns a portion of every network transaction fee users pay.
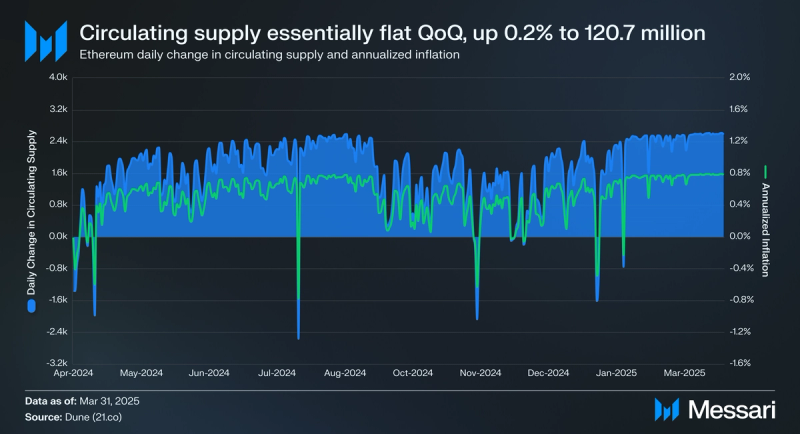
As such, when issuance > burn, Ethereum’s circulating supply is inflationary. Circulating supply has been increasing since Q2’24 due to decreasing network usage. As for Q1, Ethereum’s circulating supply increased by 0.2% QoQ from 120.5 million to 120.7 million. Furthermore, Ethereum’s annualized inflation rate stood at 0.6% (up 76% QoQ from 0.3%) by quarter end.
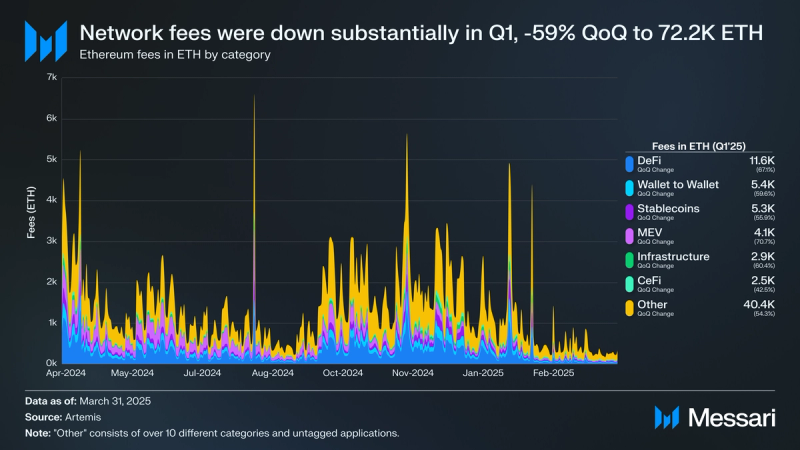
Network fees on Ethereum have been in a secular decline since they peaked in the last bull market in Q4’21. In Q1, network fees reached multi-year lows in both ETH and USD. Network fees in ETH declined 59% QoQ from 174,400 to 72,200, while network fees in USD declined 60% QoQ from $546.1 million to $216.4 million. The main cause for this decrease in network fees has been due to users’ shifting activity from Ethereum L1 to Ethereum L2s, and other L1s taking market share. Despite this decrease, Solana ($369.5 million) was the only L1 with more network fees in Q1. Furthermore, no individual category had an increase in fees in Q1:
- DeFi – down 67% to 11,600 ETH
- Wallet to Wallet – down 60% QoQ to 5,400 ETH
- Stablecoins – down 56% QoQ 5,300 ETH
- MEV – down 71% QoQ to 4,100 ETH
- Infrastructure – down 60% QoQ to 2,900 ETH
- CeFi – down 43% QoQ to 2,500 ETH
Network Overview
Onchain Activity
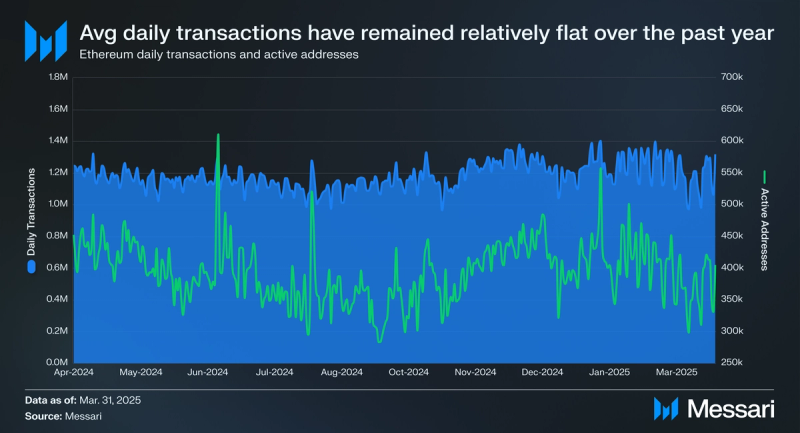
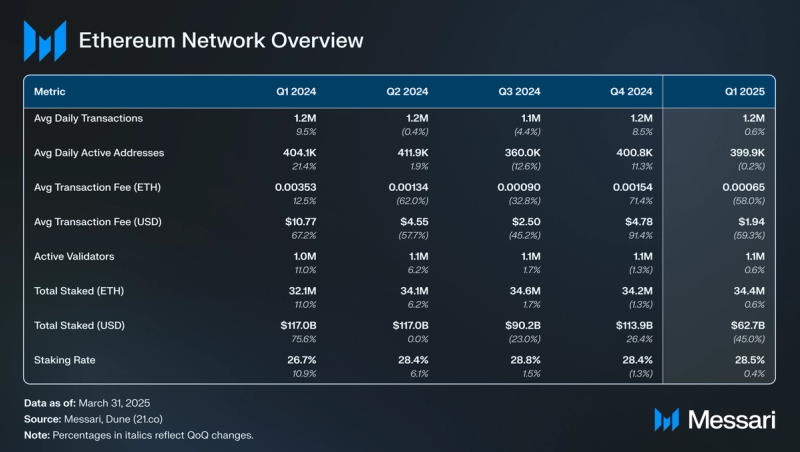
Onchain activity trended flat in Q1. Daily average transactions were up 1% QoQ from 1.22 million to 1.23 million, while daily average active addresses fell slightly by 0.2% QoQ from 400,800 to 399,900. Daily average transactions have remained steady over the past 4 quarters, consistently around 1.2 million.
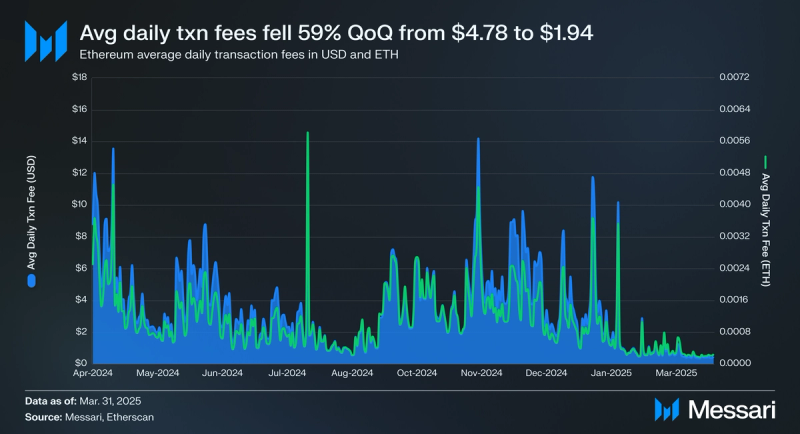
Ethereum transaction fees consist of a base fee, which adjusts automatically based on network demand and is burned, and a priority fee, an optional tip given to validators to encourage faster inclusion in a block. With demand for Ethereum blockspace decreasing, daily average transaction fees were down in Q1. Daily average transaction fees in ETH were down 58% QoQ to 0.00065 ETH, while in USD were down 59% QoQ to $1.94.
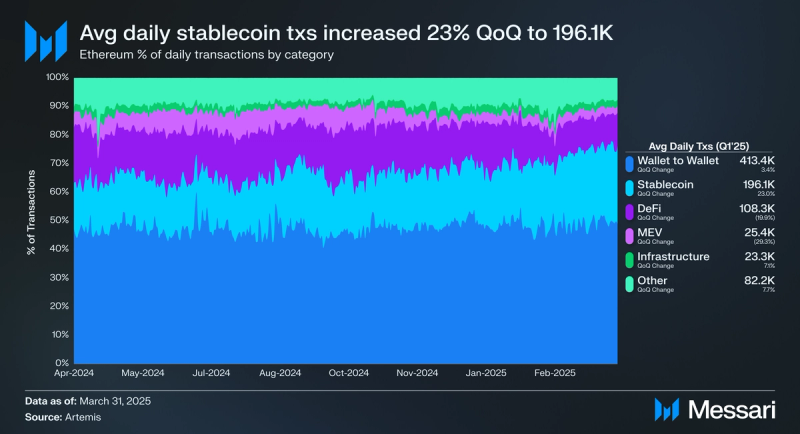
The majority of transactions in Q1 were driven by two categories: wallet-to-wallet and stablecoins. Wallet-to-wallet transactions have historically been the predominant driver of transaction activity on Ethereum, and Q1 was no exception. Daily average transactions for this category increased 3% QoQ to 413,400, and accounted for 49% of all transactions in Q1. Stablecoin transactions saw the biggest QoQ increase in Q1, with the daily average up 23% QoQ to 196,100 (23% of all transactions). Combined, wallet-to-wallet and stablecoin transactions accounted for 72% of all transactions in Q1 (up 6% QoQ from 68%). On the other hand, daily average transactions related to DeFi (down 20% QoQ to 108,300) and MEV (down 29% QoQ to 25,400) saw decreases.
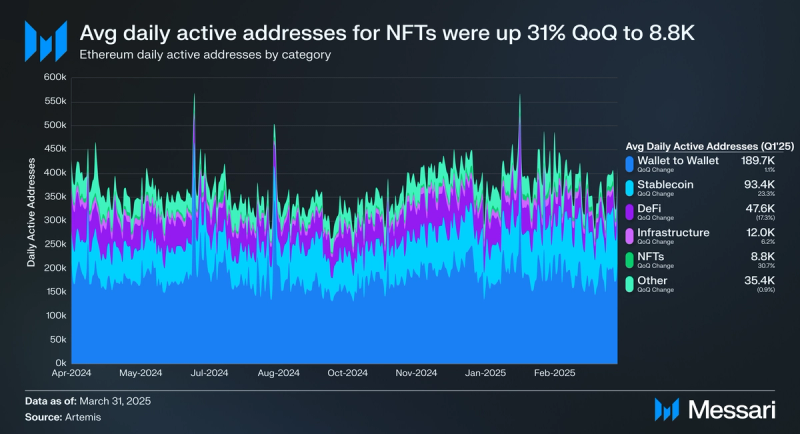
Daily active addresses experienced similar trends to transactions in Q1. Wallet-to-wallet (up 1% QoQ to 189,700 daily average active addresses) and stablecoins (up 23% QoQ to 93,400 daily average active addresses) accounted for the majority of active addresses in Q1, while DeFi (down 17% QoQ to 47,600 daily average active addresses) saw a decline in active addresses in Q1. Notably, however, active addresses related to NFTs saw a large increase in daily average active addresses, up 31% QoQ from 6,800 to 8,800. This increase can be potentially attributed to an increase in activity on OpenSea, which confirmed an upcoming token launch in February.
Staking
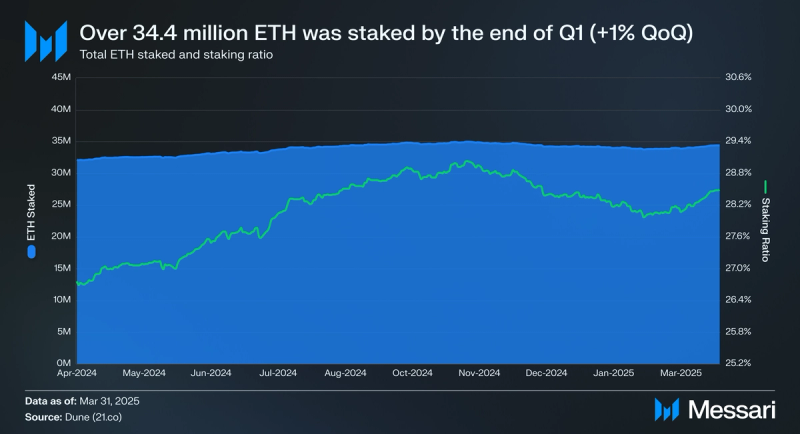
After decreasing in Q4, total staked ETH and the staking ratio both rebounded in Q1. By quarter end, 34.4 million ETH was staked, up 1% QoQ from 34.2 million. This equates to a staking ratio of 28.5%, up slightly from 28.4%. In USD terms, however, total stake was down due to ETH’s price drop. Total stake in USD decreased 45% QoQ from $113.93 billion to $62.70 billion. Despite the decline, Ethereum remained the leading PoS network by USD stake value. Lastly, at the end of Q1, Ethereum validators were earning an estimated APR of 3.14%.
A key potential catalyst for ETH staking in 2025 is the prospect of staking being integrated into existing ETH ETFs. With the changing regulatory landscape in the United States, the Securities and Exchange Commission (SEC) has shown signs of a more open stance toward the inclusion of staking within ETF products. For a deep dive on this subject, check out Messari’s report on staked ETH ETFs.
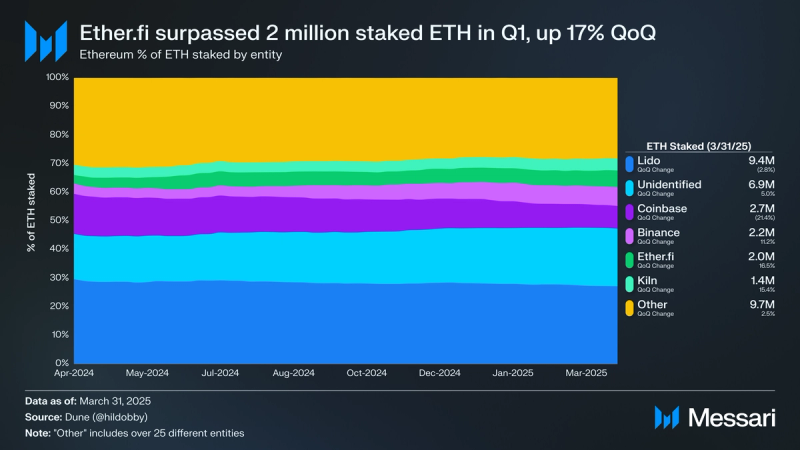
Broken down by entity, staked ETH remains well distributed, as no singular entity controls more than 33% of staked ETH. Lido remained the largest entity by staked ETH, despite its staked ETH decreasing 3% QoQ to 9.4 million (27% of stake). Notably, Lido consists of over 500 different sub-entities. Coinbase continued bleeding market share in Q1, as its staked ETH holdings dropped 21% QoQ to 2.74 million (8% of stake). The biggest beneficiaries of Coinbase losing market share were Ether.fi (up 17% QoQ to 2.0 million ETH) and Kiln (up 15% QoQ to 1.4 million ETH).
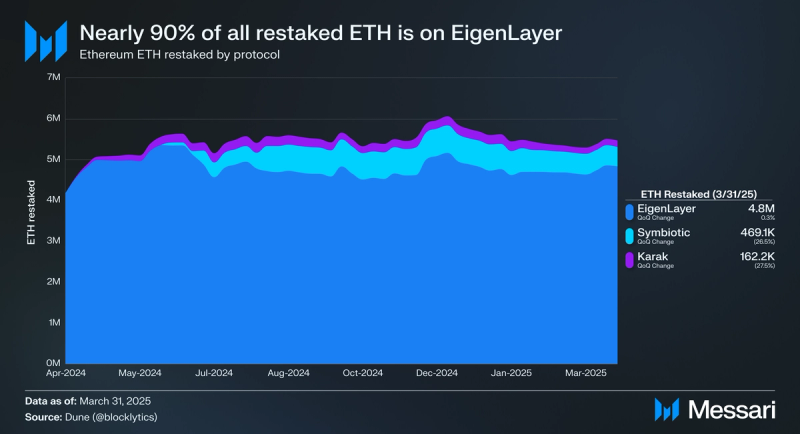
A major theme for Ethereum over the past year has been restaking. Restaking is a mechanism that allows stakers to reuse (or “restake”) their staked ETH to secure additional protocols. To date, there are 3 main protocols that enable users to restake ETH: EigenLayer, Symbiotic, and Karak. EigenLayer has historically been the predominant restaking protocol, with 89% of all restaked ETH on the platform. Both Symbiotic (down 27% QoQ) and Karak (down 28% QoQ) saw sharp declines in restaked ETH in Q1. By quarter-end, 5.5 million ETH were restaked, down 4% QoQ from $5.7 million. Approximately 16% of all staked ETH was restaked.
Prague-Electra (Pectra) Upgrade
On May 7, 2025, after Q1 ended, Ethereum successfully implemented the Pectra upgrade, its most comprehensive network-wide update since The Merge in September 2022. The upgrade bundled 11 Ethereum Improvement Proposals (EIPs), targeting usability, validator efficiency, rollup scalability, and the long-term evolution of the Ethereum Virtual Machine (EVM). Pectra is a clear reflection of Ethereum’s continued pivot toward a more modular, developer-friendly, and scalable protocol.
One of the most impactful changes is EIP-7702, which introduced a new account abstraction model for externally owned accounts (EOAs). This allows EOAs, previously limited to basic key-pair functionality, to act more like smart contracts. It enables features like transaction batching, sponsoring fees, and custom validation logic, making wallets more flexible and user-friendly. EIP-7702 effectively brings Ethereum closer to the long-term goal of smart account infrastructure, a foundational component for better UX and onboarding.
EIP-7251 raised the maximum stake per validator from 32 ETH to 2,048 ETH, a move designed to improve staking efficiency and reduce validator set bloat. With this change, larger operators can consolidate stake under fewer validators without compromising decentralization. This lays the groundwork for more scalable validator infrastructure and supports Ethereum’s long-term ambitions around statelessness and lightweight clients.
Scalability at the data layer also received a boost through the inclusion of PeerDAS (Peer Data Availability Sampling). While not tied to a single EIP, this feature introduces a more efficient way for nodes to verify data availability in rollup submissions. PeerDAS is a critical step toward full Danksharding, enabling Ethereum to handle a higher volume of rollup data with less overhead. This supports Ethereum’s core goal of scaling execution offchain while maintaining robust onchain data guarantees.
Pectra also included an increase in the maximum number of blobs per block, building on the foundations laid by EIP-4844 in the Dencun upgrade. While Dencun originally allowed up to 6 blobs per block, the Pectra upgrade raised this limit to 12, effectively doubling Ethereum’s blobspace capacity. This upgrade directly benefits L2 rollups, which rely on blobs to post data cheaply to Ethereum. By expanding blob throughput, Ethereum has improved scalability for rollups without impacting execution-layer congestion, reinforcing its role as a high-throughput, low-cost data availability layer.
Lastly, EIP-3540 introduced the first iteration of the EVM Object Format (EOF), a restructuring of how smart contracts are stored and processed by the EVM. EOF improves contract safety by separating code and data sections, enabling future upgrades like versioning and modular contract extensions. This is a forward-looking change that modernizes the EVM and prepares it for continued innovation without sacrificing backward compatibility.
Collectively, the Pectra upgrade represents a clear signal of where Ethereum is heading: toward greater modularity, usability, and scalability. It doesn’t radically transform the network in a single stroke, but it tightens the foundation for Ethereum’s next era, where smart accounts become standard, rollups scale seamlessly, and protocol upgrades become safer and more sustainable. Pectra is not the destination, but it’s a decisive step in Ethereum’s transition from a general-purpose network to a modular execution environment that supports billions of users without compromising on decentralization.
Ecosystem Overview
Layer-2s
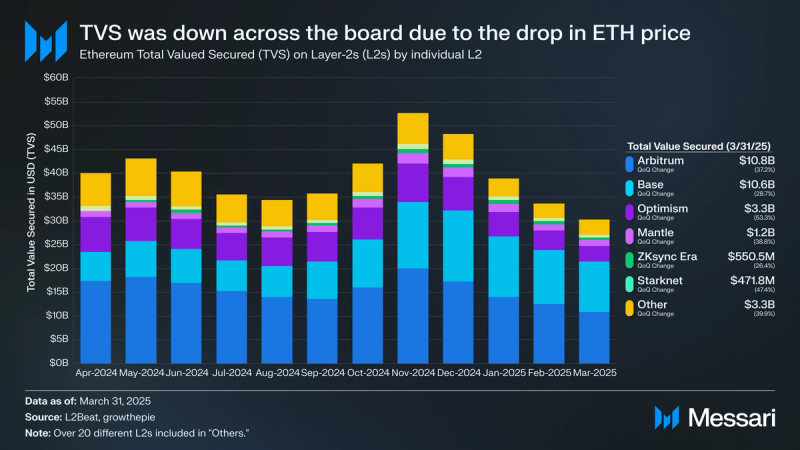
Total Value Secured (TVS) measures the sum of all assets on Ethereum L2s. The competition for TVS among L2s remains intense, with new entrants emerging each quarter and mercenary capital moving from chain to chain. The majority of TVS has gravitated towards 2 L2s: Arbitrum and Base. Base has been steadily gaining ground on Arbitrum over the past few quarters, and nearly surpassed it in Q1. However, both L2s ended up with declines in TVS due to a decrease in crypto prices. Arbitrum’s TVS decreased 37% QoQ to $10.84 billion, representing 36% of all TVS, while Base’s TVS decreased slightly less at 29% QoQ to $10.61 billion, representing 35% of all TVS. Combined, the 2 accounted for 71% of TVS, up 6% QoQ. No L2 within the top 6 had a QoQ increase in TVS.
DeFi
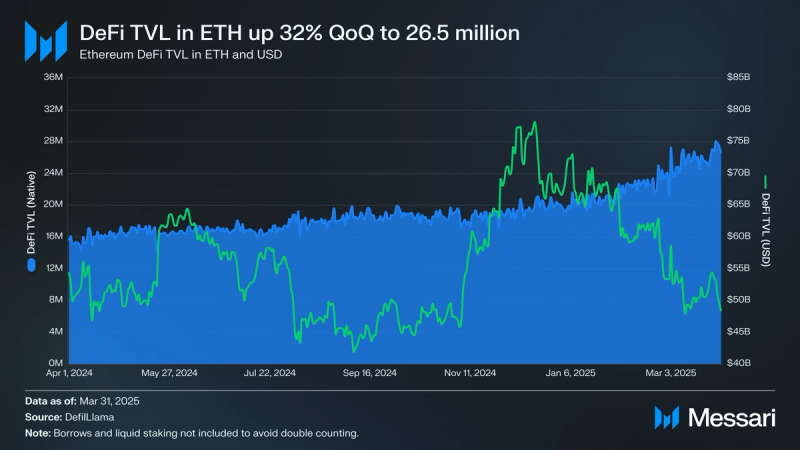
Ethereum DeFi TVL denominated in USD decreased from $66.99 billion in Q4 to $48.31 billion, a 28% QoQ decrease. Despite this decrease, Ethereum was still ranked the highest network by TVL, denominated in USD, by the end of the quarter. Furthermore, Ethereum accounted for nearly 56% of all DeFi TVL, down 11% QoQ from 63%. TVL denominated in ETH was up in Q1, increasing 32% QoQ from 20.1 million to 26.5 million ETH.
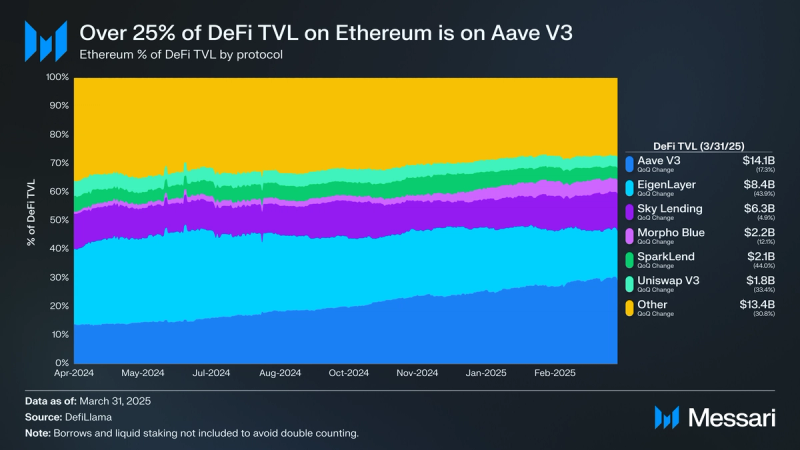
Due to the overall decrease in DeFi TVL in USD in Q1, most of the major DeFi protocols on Ethereum experienced QoQ declines. Aave V3, the predominant lending protocol on Ethereum, saw its TVL decline by 17% QoQ to $14.08 billion. Active borrows on the platform also decreased, falling 21% QoQ from $12.48 billion to $9.86 billion. Despite the overall decline in TVL, Aave V3’s share of TVL increased, up 15% QoQ from 25% to 29%. Sky Lending was another notable gainer for TVL share, increasing 32% QoQ from 10% to 13%. Its TVL in USD decreased 5% QoQ from $6.66 billion to $6.34 billion. The other 2 lending protocols in the top 6, Morpho Blue (down 12% QoQ to $2.20 billion) and SparkLend (down 44% QoQ to $2.12 billion), also saw TVL decreases. These 4 lending protocols (Aave V3, Sky Lending, Morpho Blue, and SparkLend) account for the majority of DeFi TVL on Ethereum (51%).
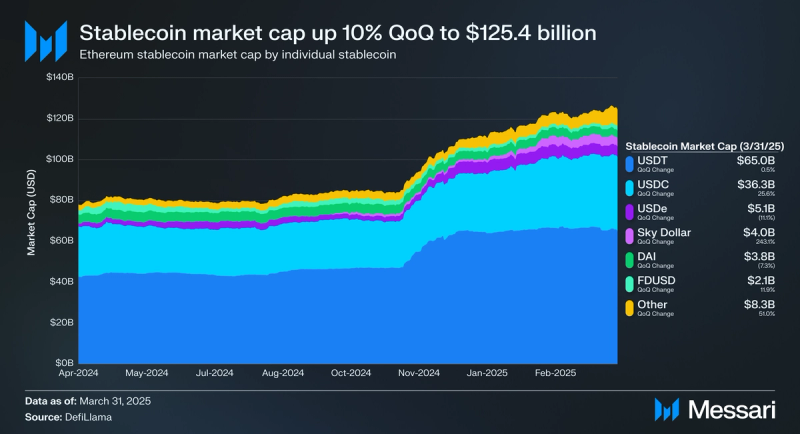
One of the biggest trends in crypto over the past few quarters has been the growth of stablecoins. As the network with the highest market cap of stablecoins, Ethereum has benefited greatly from this broader trend. Total stablecoin market cap was up 10% QoQ from $113.68 billion to $125.35 billion. This marked the 6th straight quarter of stablecoin growth on Ethereum.
Broken down by individual stablecoins, Tether’s USDT represents the majority (52% market share) of stablecoins on Ethereum. Its supply increased 1% QoQ from $64.67 billion to $64.99 billion. Circle’s USDC caught up ground on USDT, increasing its supply by 26% QoQ from $28.87 billion to $36.26 billion. Combined, USDT and USDC accounted for 81% of the stablecoin supply by Q1 end, down 3% QoQ from 84%. The biggest gainer in percentage terms was Sky’s USDS, as supply increased 243% QoQ from $1.17 billion to $4.02 billion. Sky’s attractive rewards program has helped bolster its growth.
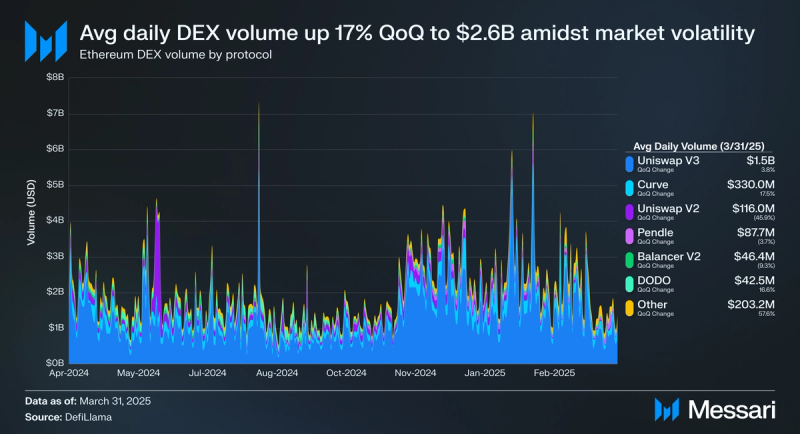
Heightened volatility across the crypto markets helped elevate Ethereum DEX volume in Q1. Daily average DEX volume (USD) on Ethereum increased 17% QoQ from $2.21 billion to $2.59 billion. Ethereum had the 2nd most DEX volume of any network in Q1 ($233.03 billion), only being surpassed by Solana ($414.33 billion).
Uniswap V3 has historically been the largest DEX by volume on Ethereum, and Q1 was no exception. Its daily average volume increased 4% QoQ from $1.44 billion to $1.49 billion. Uniswap V3 accounted for 64% of all DEX volume on Ethereum in Q1. Looking forward, it will be interesting to see how Uniswap V3 volumes shift to Uniswap V4, which launched in January 2025, but saw modest volumes in Q1 ($2.27 billion in volume for the entire quarter).
Curve was a notable gainer in Q1 as its daily average volume increased 18% QoQ from $280.9 million to $330.0 million. Curve is a major beneficiary of the stablecoin trend, and its increase in volume reflected that this quarter. Curve accounted for 14% of all DEX volume on Ethereum in Q1. The only other DEX to eclipse a 5% market share this quarter was Uniswap V2. However, its daily average volume fell 46% QoQ from $214.4 million to $116.0 million. Uniswap V2 is a popular DEX choice for longer-tail assets like memecoins. With memecoin activity shifting away from Ethereum to other networks like Solana and Base, Uniswap V2’s volumes suffered.
NFTs
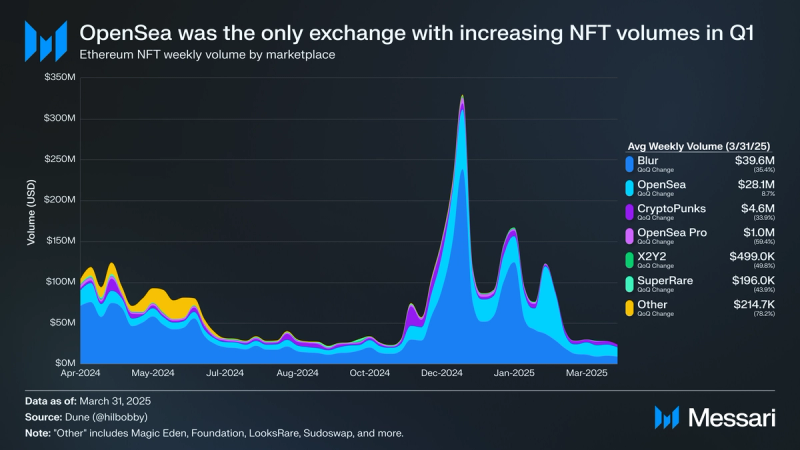
NFT volumes pulled back after surging in Q4 when popular NFT projects like Pudgy Penguins and Remilia launched their own tokens. With the hype from these token launches dying down, weekly average NFT volume fell 25% QoQ from $99.1 million to $74.1 million.
Most NFT exchanges experienced a decline in volumes as a result, except for OpenSea. OpenSea confirmed an upcoming token launch in February 2025, which has led users to shift volumes to the platform in hopes of an airdrop. Weekly average volumes on OpenSea increased 9% QoQ from $25.9 million to $28.1 million. Combined with Blur, the 2 NFT exchanges accounted for 91% of NFT volume on Ethereum this quarter.
Closing Summary
Ethereum faced significant headwinds in Q1 2025, from macroeconomic pressure and price underperformance to declining network fees and DeFi TVL. Yet amidst this turbulence, the network demonstrated resilience across its L2 ecosystem, staking infrastructure, and stablecoin economy. Key protocol upgrades like Pectra signal long-term investment in scalability and usability, even as near-term market sentiment remains cautious.
While activity on Ethereum L1 stagnated, the ecosystem continues to evolve beneath the surface. Stablecoin growth, DEX volume resilience, and L22 traction reflect a still-robust foundation. With staking integration into ETFs on the horizon and a maturing ecosystem, Ethereum remains poised for renewal as broader market conditions stabilize.


