

Market Overview — ICP crypto
Short-term trend shows upward pressure while market sentiment is cautious. Moreover, volatility expanded on the daily ATR, suggesting active rotation. BTC dominance sits at a high level, and the Fear & Greed reading signals risk aversion. Consequently, liquidity is selective and moves can be sharp.
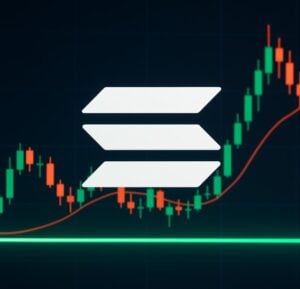
Technical Analysis
Daily Chart (D1)
| Indicator | Value |
|---|---|
| EMA20 | 4.43 |
| EMA50 | 4.18 |
| EMA200 | 5.06 |
EMA20, EMA50 and EMA200 are below price at 4.43, 4.18 and 5.06 respectively, which indicates a multi-length bias to the upside on D1. Interpretation: price is above key moving averages and that implies trend support on pullbacks.
RSI14 is 83.01 on D1. Interpretation: the daily RSI is overbought and therefore momentum is strong but a pullback or consolidation is likely.
MACD shows line 0.67 vs signal 0.16 and hist 0.51. Interpretation: MACD is bullish and accelerating, which confirms the recent strength on D1.
Bollinger Bands mid 3.86, upper 6.57 and lower 1.14 show the price sitting above the upper band. Interpretation: expansion is in place and the band structure signals a strong directional move with elevated stretch risk.
ATR14 is 0.87 on the daily. Interpretation: average true range is elevated and thus position sizing should account for wider swings.
Daily pivot structure: PP 7.65, R1 8.85, S1 6.41. Interpretation: the pivot points frame immediate reaction levels and imply resistance near 8.85 and support near 6.41.
Main scenario from D1: the regime is marked as neutral by the feed, yet the indicators lean bullish with overbought momentum. Therefore the primary read is neutral-to-bullish, with risk of mean reversion.
Intraday Sentiment (H1–M15) — ICP price
H1 reads bullish with close 7.61, EMA20 7.45 and EMA50 6.64. Moreover, H1 RSI at 56.33 is balanced and MACD shows a narrow positive histogram (0.02). Interpretation: hourly structure supports continuation but lacks strong momentum.
M15 is neutral with close 7.62, EMA20 7.97 and EMA50 7.73. In contrast, M15 RSI at 40.59 and MACD negative hist (-0.11) indicate short-term exhaustion. Interpretation: intraday pullbacks are possible and must be watched for reversals.
Key Levels and Pivot Zones
| Zone | Price (USDT) |
|---|---|
| Support | 6.41 |
| Resistance | 8.85 |
Price reacts predictably at the pivot zones. Consequently, a clean break above 8.85 would open further extension, while a firm drop below 6.41 would increase downside risk.
Trading Scenarios
Bullish Setup: If price sustains above the daily pivot PP 7.65 and clears 8.85, momentum traders may add on retest. If confirmed, targets can be extended while maintaining stop under recent swing lows. Moreover, rising MACD and persistent RSI support continuation.
Bearish Setup: However, should the market reject near the upper Bollinger expansion and RSI roll lower, watch for a drop toward S1 6.41. On the other hand, breach below 6.41 would invalidate bullish edge and favor short bias.
Neutral Range: Meanwhile, consolidation between PP 7.65 and R1 8.85 would mark range trade opportunities. In addition, intraday sellers may emerge if M15 momentum fails to sustain.
Market Context
| Metric | Value |
|---|---|
| Total Market Cap | 3,407,866,553,679.9985 |
| BTC Dominance | 58.23% |
| Fear & Greed Index | 24 (Extreme Fear) |
| 24h Volume Change | not provided |
Macro sentiment is cautious and liquidity rotated toward BTC dominance. Indeed, market cap fell roughly -2.56% in the last 24h, which signals risk-off tilt. Furthermore, DeFi TVL and on-chain flows were not provided, yet the report notes the defi.chain is internet-computer.
That said, watch macro cues and BTC moves for larger correlation shifts. Moreover, extreme fear often precedes sharp bounces, so risk management is essential.
Final Outlook
Overall, the main D1 scenario is neutral with a bullish bias due to moving averages and MACD strength. ICP crypto shows overbought daily momentum so traders should expect possible pullbacks. Therefore the short-term stance is conditional bullish, but confirmation at pivot levels is required.
This analysis is for informational purposes only and does not constitute financial advice.
Readers should conduct their own research before making investment decisions.


