

In this phase Zcash crypto is trading in a corrective environment, where short-term weakness clashes with a still resilient longer-term structure.
Daily chart (D1): macro bias – neutral regime, bearish skew
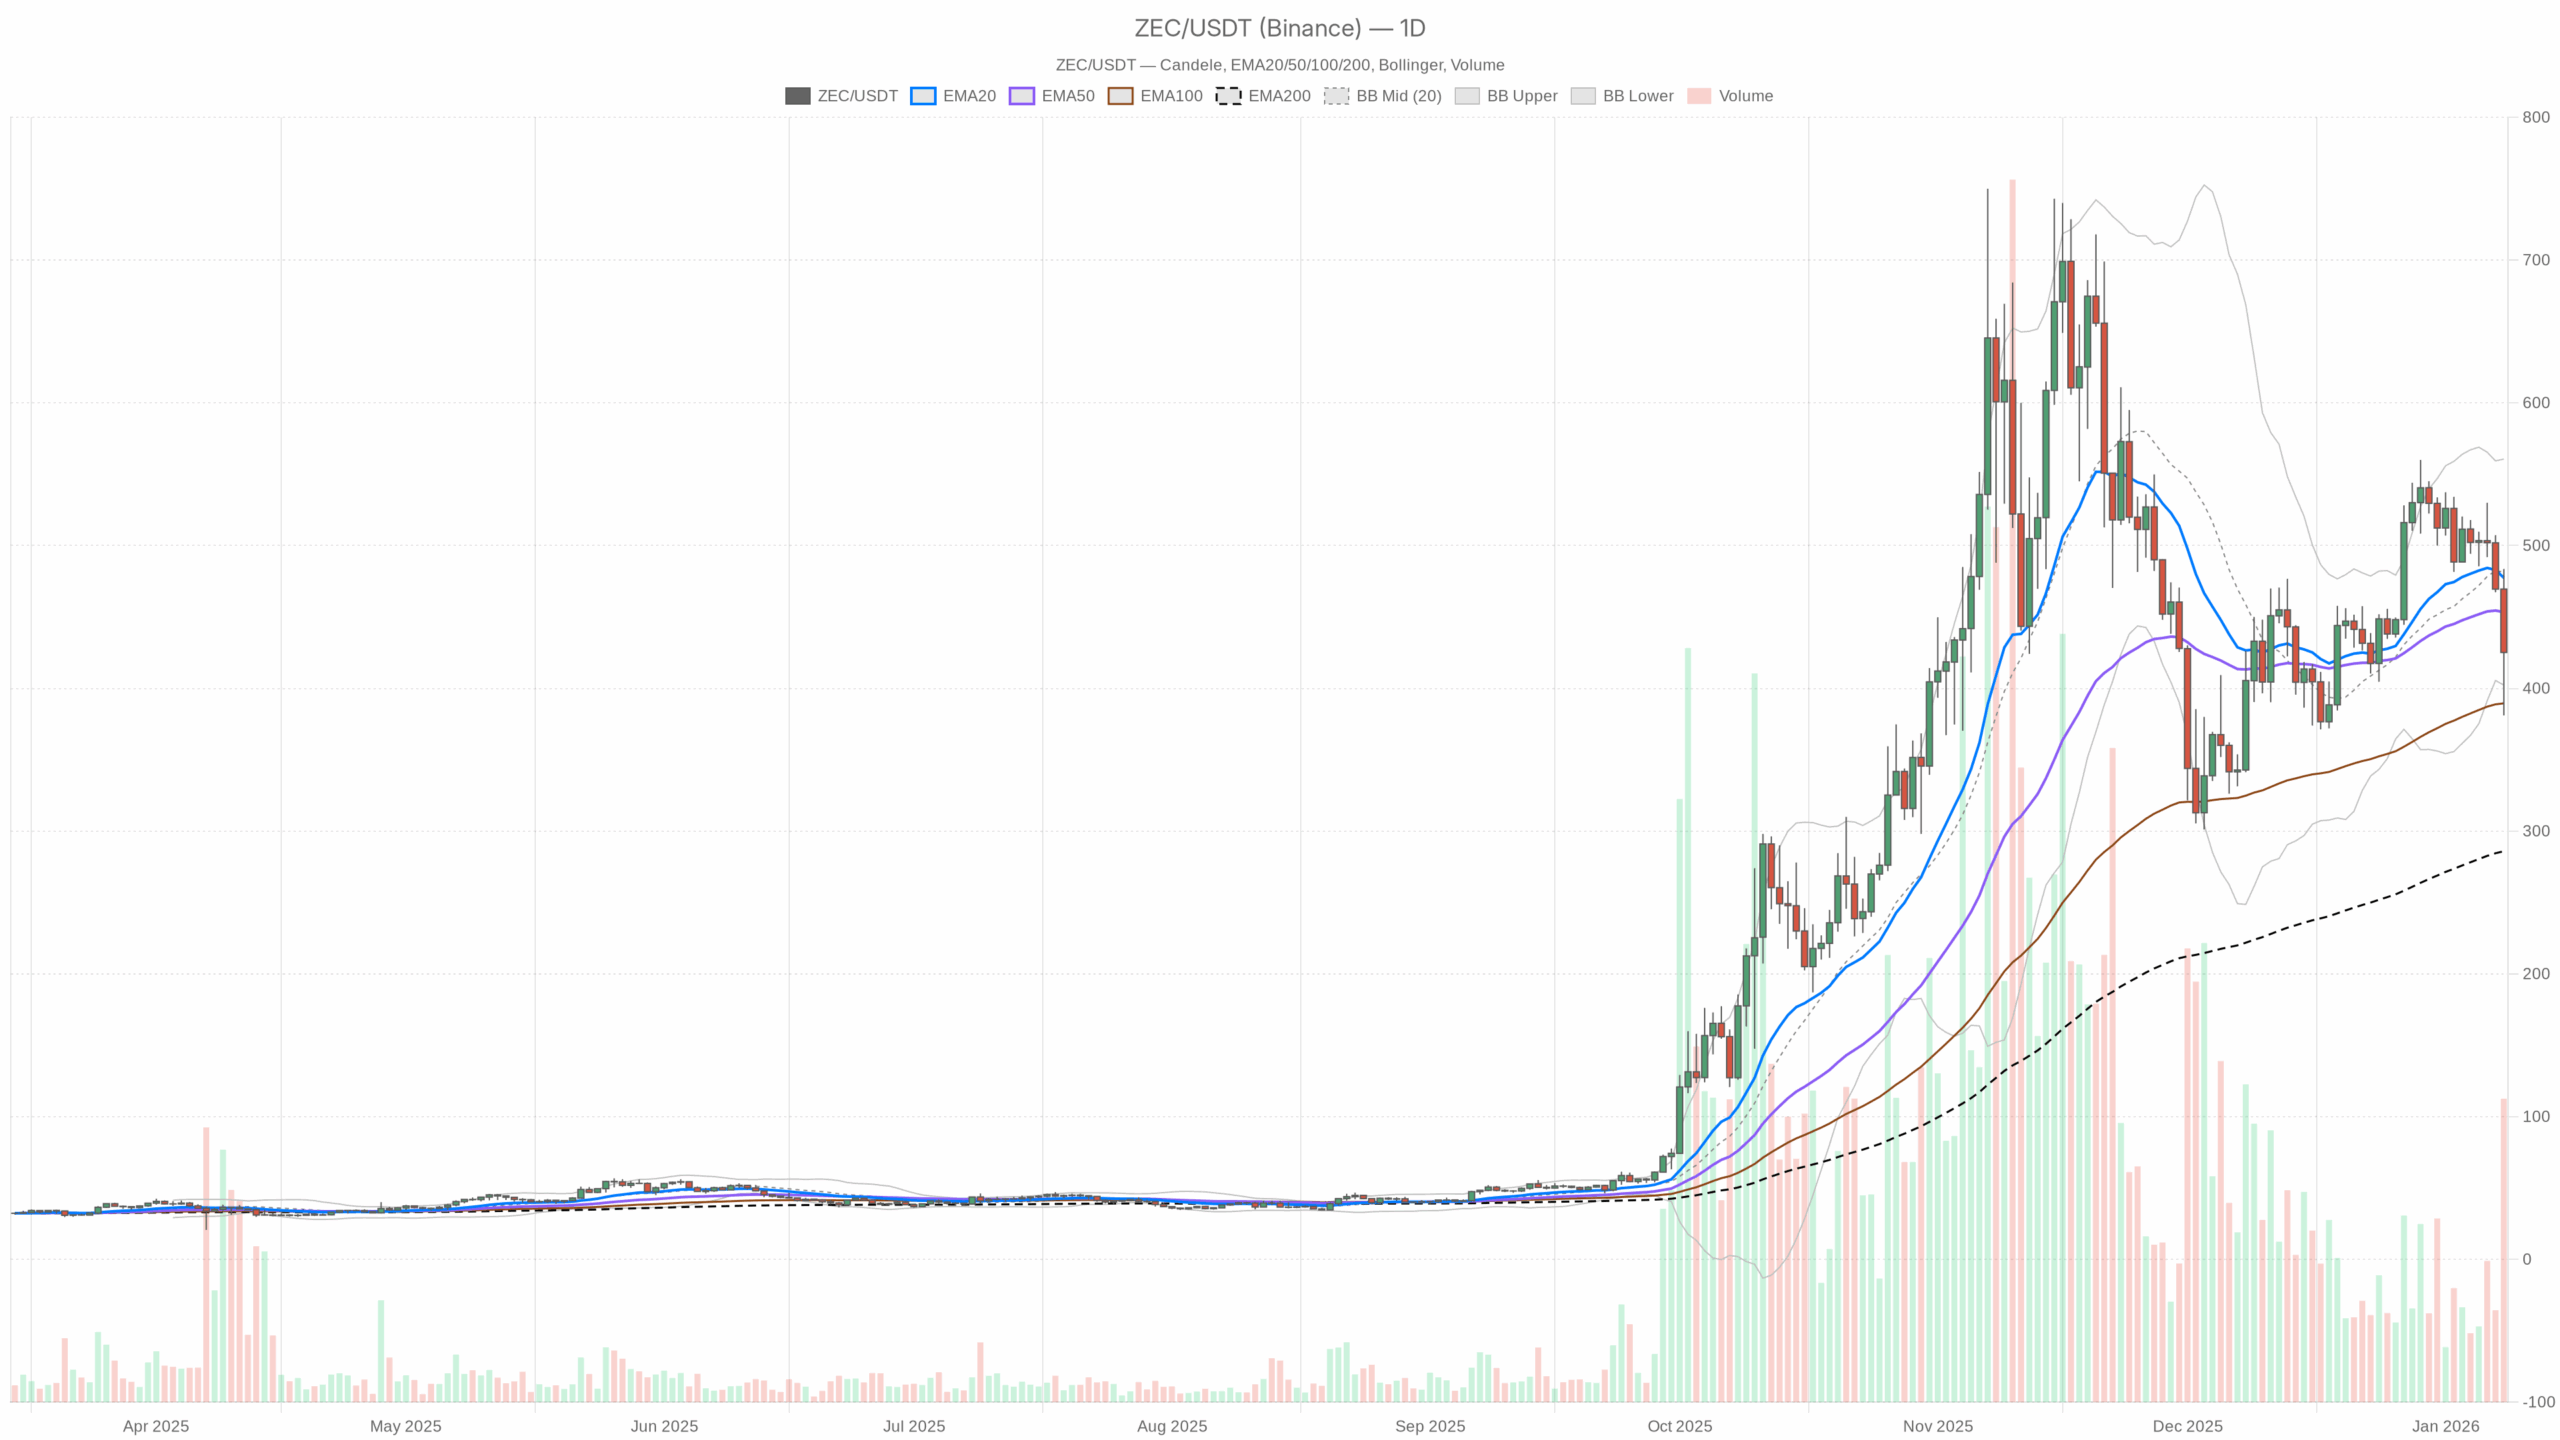
Trend structure: EMAs
Daily close: 425.13 USDT
EMA 20: 477.44 USDT
EMA 50: 453.35 USDT
EMA 200: 285.91 USDT
ZECUSDT is trading below the 20-day and 50-day EMAs but still well above the 200-day EMA. That combination usually describes a corrective phase within a larger uptrend: the longer-term structure is still constructive, but the shorter-term momentum has flipped in favor of sellers.
The 20-day EMA is now significantly above price and below the Bollinger mid-band, acting as near-term dynamic resistance. Moreover, the 50-day EMA, just above price at 453, is the more structural line: as long as ZEC trades under this level, any bounce is suspect and can be faded by short-term traders.
Implication: The higher-timeframe trend is intact, but for now rallies toward 450–480 USDT are more likely to meet supply than start a fresh impulse higher.
Momentum: RSI (14)
RSI (14) D1: 41.72
Daily RSI is sitting in the low 40s, below the midpoint but not yet oversold. That typically characterizes a controlled downtrend or consolidation with a bearish tilt. There is room for price to push lower before momentum becomes stretched enough to force short-covering or dip-buying.
Implication: Sellers have the upper hand, but this is not a panic leg. Downside can continue gradually without immediate technical relief.
Trend-momentum mix: MACD
MACD line: 9.48
Signal line: 16.40
Histogram: -6.92
The MACD line is below the signal, with a negative histogram. That is a standard sell-phase configuration after a previous up-move. The spread is not extreme, but the signal is clearly in favor of bears for now, confirming that the recent momentum swing is down, not sideways.
Implication: The daily momentum cycle is still in its bearish leg. Any bounce on the daily is more likely to be a counter-trend move until MACD starts flattening or crossing back up.
Volatility & range: Bollinger Bands + ATR
Bollinger Bands (20):
Mid-band: 481.47 USDT
Upper band: 560.66 USDT
Lower band: 402.27 USDT
ATR (14) D1: 41.65 USDT
Price is trading near the lower Bollinger band at 402 while the close is around 425. ZEC has pushed into the lower volatility envelope and is now hovering just above it. That is classic late-stage-down-leg behavior: not yet a confirmed reversal, but this is where mean reversion trades start to become interesting if buyers show up.
Daily ATR around 42 USDT means a typical daily swing is roughly 10% of price. Volatility is elevated enough that support and resistance levels are more like zones than precise lines.
Implication: The market is pressing the lower edge of its recent volatility range. Further downside is possible, but risk-reward for fresh shorts worsens the closer we drift to 400–380 USDT unless volatility expands again.
Key levels: daily pivot
Pivot point (PP): 429.92 USDT
Resistance 1 (R1): 478.84 USDT
Support 1 (S1): 376.21 USDT
Price is currently a touch below the daily pivot at 429.92. That keeps the intraday bias mildly negative while we stay under that line. R1 at 478.84 lines up closely with the cluster of the 20-day EMA and Bollinger mid-band, making the 470–480 USDT area a thick resistance band. S1 down at 376 is the first clearly defined downside objective if the current support below 420 gives way.
Implication: The market is trading in the lower half of its daily pivot range. It will take a decisive reclaim of 430 then 470–480 to flip the narrative back in favor of the bulls.
Hourly chart (H1): sellers in control, but momentum is easing
The hourly structure is outright bearish, more aggressive than the daily.
H1 close: 425.46 USDT
EMA 20: 435.55 USDT
EMA 50: 462.33 USDT
EMA 200: 491.21 USDT
Regime: Bearish
Price trades below all three key EMAs on the hourly, and they are stacked in a bearish order (20 < 50 < 200) with clear downward slopes. This is what a short-term downtrend looks like when it is in full control.
Implication: For active traders, the H1 chart says: every bounce into 435–460 USDT has been and likely remains a selling opportunity until the EMAs flatten and price can hold above the 20-EMA.
H1 momentum: RSI & MACD
RSI (14) H1: 40.67
MACD H1: line -20.58, signal -19.01, hist -1.57
Hourly RSI mirrors the daily: low 40s, indicating persistent but not extreme selling. The MACD is below the signal with a small negative histogram. That combination tells us the downtrend is alive but losing some punch. The aggressive momentum phase is already behind us.
Implication: Shorts are still in charge, but chasing new positions at these levels on H1 carries more whipsaw risk. Better entries are on bounces, not breakdowns, unless we see a fresh expansion in downside momentum.
H1 volatility & levels
Bollinger mid (H1): 442.39 USDT
Upper: 508.02 USDT
Lower: 376.76 USDT
ATR (14) H1: 19.85 USDT
Pivot (PP): 423.58 USDT
R1: 437.17 USDT
S1: 411.88 USDT
ZEC is sitting just above the hourly pivot at 423.58, with the Bollinger mid-band around 442. This sets a clean intraday structure: 424 is the immediate battle line, 437–442 is the first resistance zone where sellers are likely to reassert themselves, and 412 is the intraday support where buyers will try to hold the line.
Implication: The hourly chart allows for a tactical bounce toward 437–442, but, within the current regime, that area is more a shorting zone than the start of a full trend reversal.
15-minute chart (M15): execution context – short-term relief bounce
The 15-minute chart is only relevant for timing; it does not change the core thesis.
M15 close: 425.71 USDT
EMA 20: 411.77 USDT
EMA 50: 424.91 USDT
EMA 200: 463.70 USDT
Regime: Neutral
On this shorter timeframe, price is now above the 20-EMA and roughly sitting on the 50-EMA, while still far below the 200-EMA. That is the classic micro relief-bounce setup inside a larger downturn.
RSI (14) M15: 59.36 – approaching bullish without being overbought.
MACD M15: line -0.56, signal -5.48, hist 4.91 – a positive histogram showing a short-term bullish momentum burst.
Implication: Very short term, buyers are trying to reclaim some ground after a selloff. This is more likely a pause or a counter-trend bounce than the start of a full trend reversal unless it propagates to the hourly chart.
M15 Bollinger Bands:
Mid: 404.09 USDT
Upper: 424.97 USDT
Lower: 383.21 USDT
ATR (14) M15: 8.58 USDT
Pivot (PP): 426.47 USDT
R1: 429.90 USDT
S1: 422.28 USDT
Price is hugging the upper 15-minute Bollinger band right around the local pivot. That is a signature of a short-term squeeze higher. However, with hourly and daily still tilted bearish, these small-timeframe squeezes often become liquidity for larger players to sell into.
Implication: Expect choppy two-way action intraday. The micro bounce can extend a bit, but the burden of proof is on buyers to carry it into higher timeframes.
Reconciling timeframes: where the tension sits
The story across timeframes is coherent but tense:
- Daily: Neutral regime with a bearish skew – corrective phase within a longer-term uptrend.
- Hourly: Clean downtrend – sellers control the tape.
- 15-min: Short-term relief bounce – buyers are active, but only tactically.
This is exactly the environment where impatient traders get chopped up. The higher timeframes say sell strength, while the intraday action teases bounces that look bigger than they truly are.
Scenarios for ZECUSDT
Bullish scenario
For the bullish side to take over, ZEC needs to turn this micro bounce into a structural reclaim.
What bulls want to see:
- On the hourly chart, a sustained move and close back above 437–442 USDT (H1 R1 and Bollinger mid), followed by holding above the 20-EMA on pullbacks.
- On the daily chart, a push back to and then above the daily pivot at ~430, and more importantly, a decisive break and close above the 50-day EMA around 453.
- Daily RSI climbing back above 50, with the MACD histogram flattening and turning positive.
If that sequence plays out, the first upside target zone is 470–480 USDT (confluence of the 20-day EMA, daily R1, and Bollinger mid-band). Above that, the next logical extension sits toward the 500–520 USDT region.
What invalidates the bullish scenario: A clean break and daily close below 400–390 USDT (sustained trading under the lower daily Bollinger band and pushing toward S1 around 376) would show that buyers have completely lost the range and the correction is morphing into a deeper downtrend.
Bearish scenario
The bears already have the advantage; their scenario is about continuation rather than reversal.
What bears want to see:
- Hourly rallies into 435–450 USDT failing repeatedly, with price unable to hold above the H1 20-EMA.
- Daily price staying pinned below the 430 pivot and below the 50-day EMA at 453.
- Daily RSI grinding from low 40s toward the mid-30s without sharp reversal spikes – a controlled bleed lower.
Under that script, the next downside magnets are:
- 402–400 USDT: lower daily Bollinger band area – first test of the edge of the current volatility envelope.
- 380–376 USDT: cluster around daily S1 – where more meaningful dip-buying interest might appear.
A break and hold under 376 USDT would open the door to a much deeper retrace toward previous consolidation zones closer to the 200-day EMA, though the exact levels are not in the dataset.
What invalidates the bearish scenario: Multiple daily closes back above the 50-day EMA (~453) and a clear shift of daily RSI back above 50 would signal that the correction is over and that bears who sold the breakdown are being squeezed out.
Positioning, risk, and how to think about ZEC here
ZECUSDT is not in a trending breakout; it is in a corrective down phase within a broader uptrend. That is an awkward zone for both sides: late shorts face poor risk-reward near the lower band, while early dip buyers risk stepping in front of a still-active sell program.
A few practical takeaways from the current structure:
- The higher timeframe bias is cautious-bearish while price stays below 450–480 USDT.
- Volatility (daily ATR ~42) means support is a zone, not an exact line; sizing and stop distances matter more than usual.
- There is a clear timeframe tension: intraday long setups can work inside a still-bearish daily picture, but they are counter-trend and should be treated as such.
For traders, this is a market where patience generally pays more than aggression. Let the levels do the talking: 400–380 USDT on the downside and 450–480 USDT on the upside are the key battlegrounds that will define whether ZEC’s next big move is a trend resumption higher or a deeper slide back toward its long-term moving averages.
If you want to monitor markets with professional charting tools and real-time data, you can open an account on Investing using our partner link:
Open your Investing.com account
This section contains a sponsored affiliate link. We may earn a commission at no additional cost to you.
This analysis is for informational and educational purposes only and should not be considered investment, trading, or financial advice. Markets are volatile and unpredictable; always perform your own research and consider your risk tolerance before making any trading decisions.
Share this content
You Might Also Like

Cybro Presale Raises Over $3M, Disrupting the Crypto Market and Aiming to Overtake Polygon and Polkadot

Democrat’s increase opposition to party’s anti-crypto position calling Bitcoin ‘the future’ of value


