
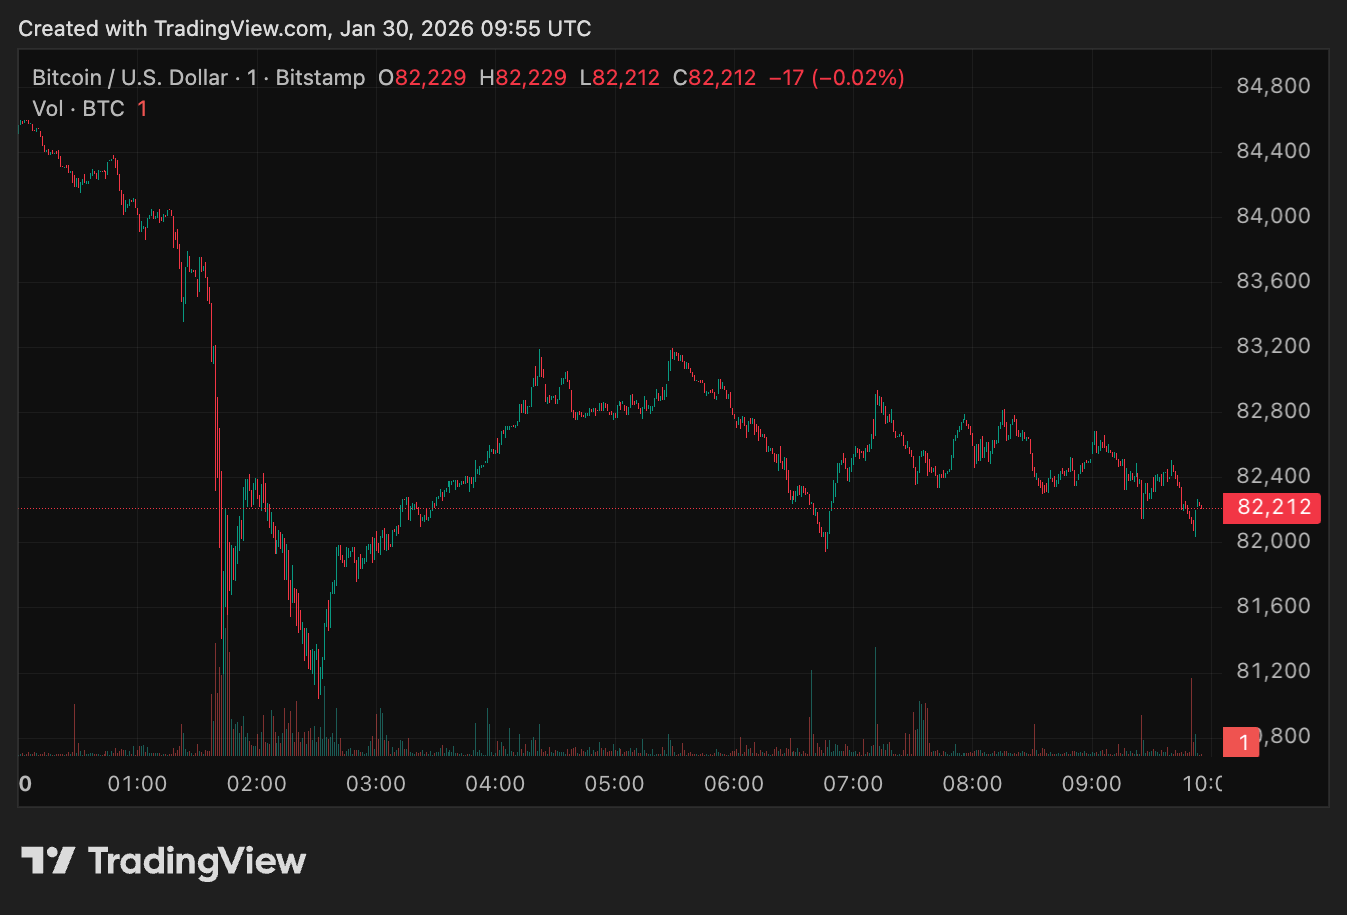
Bitcoin’s Thursday slide was a perfect illustration of a market that lost its marginal buyer and then discovered, in real time, how much leverage was sitting on top of that demand.
The move wasn’t a smooth ride lower; it came in sharp legs that pushed the price from $84,400 toward the low-$81,000s in a matter of minutes, with brief rebounds that failed to repair the damage.
The drawdown caused a massive liquidation wave that reached roughly $1.7 billion, a scale of forced unwinds that tends to appear when positioning has become one-sided and liquidity thins at the same time.
That magnitude matters because it reframes the day’s volatility as something structural rather than incidental. A 10% decline isn’t anything new for Bitcoin, but it becomes far more consequential when it compresses into hours, meets crowded leverage, and coincides with a withdrawal of steady spot demand.
The result is a market where the path matters as much as the destination, because the path determines how much mechanical selling is triggered along the way and how much risk appetite is left to respond.
However, Friday morning saw some respite with Bitcoin attempting to climb back above $83,000 after PPI data came in hotter than expected.
When the ETF bid goes missing
The best place to see steady demand weaken is the US spot Bitcoin ETF complex, which has become the main on-ramp for institutional allocators. Daily flows were already fragile heading into the second half of January before the market saw the larger break lower.
After a small +$6.8 million inflow on Jan. 26, the complex printed -$147.4 million on Jan. 27 and -$19.6 million on Jan. 28, before culminating in -$817.8 million of net outflows on Jan. 29.
Over four sessions, that’s roughly -$978 million of net redemptions, and the pattern is important because it shows a market where dip-buying through the wrapper channel failed to appear even as price weakened.
The Jan. 29 outflow print also stands out in proportion to the broader ETF regime. The average daily total listed there is about $108 million, which puts -$817.8 million at roughly 7 to 8 times a typical day. That’s the difference between routine churn and a meaningful reduction in exposure.
The concentration of outflows adds weight to the signal. IBIT (-$317.8 million), FBTC (-$168.0 million), and GBTC (-$119.4 million) together account for roughly three-quarters of the day’s total redemptions, which suggests broad allocator behavior rather than idiosyncratic moves in smaller products.

The key is understanding what ETF outflows imply without oversimplifying the mechanics.
Redemptions don’t always mean the fund is dumping BTC into the market in a single block. The intermediaries who receive inventory or assume hedges decide whether to warehouse that exposure, distribute it, or hedge it dynamically.
In a calm regime, they can absorb flow and smooth execution. In a volatile regime, they tend to reduce inventory risk, and that behavior can make spot liquidity feel thinner precisely when the market is already leaning lower.
Once the ETF wrapper channel turns into net supply rather than net demand, the spot market becomes more dependent on discretionary buyers elsewhere. When those buyers are cautious, and the derivatives market is crowded, the next leg down often travels farther than expected, because the market is no longer clearing through patient accumulation, but through position reductions.
When macro anxiety meets a leverage reset
The market’s focus on Kevin Warsh’s pick for Fed chair was one of the many political and macro catalysts for the drop. The market’s view that this was bearish for Bitcoin centered on expectations around Warsh’s monetary discipline, and preference for a smaller balance sheet, all of which are shorthand for tighter financial conditions at the margin.
In practice, Bitcoin tends to respond more to the implied path of liquidity and the willingness of markets to finance risk, not to the current level of rates. When traders feel that future liquidity could be less supportive, they often de-risk first through the most liquid instruments available, and spot ETFs sit at the top of that list.
In an environment like that, the derivatives market acts as an accelerant.
Liquidations change the character of order flow. A discretionary seller can pause, reduce size, or wait for better liquidity. A liquidation is an automated response to insufficient margin, and it tends to cluster around specific price levels that many traders share.
When price slips through those zones in a thin spot market, the forced selling becomes a self-reinforcing mechanism, and the decline takes on the “stair-step” look that Bitcoin’s chart captures, with sharp drops, reflex bounces, and then another drop when the bounce fails to draw in fresh demand.
Options markets confirmed that participants were repricing risk, not just reacting to a single headline. Deribit’s DVOL, a 30-day implied volatility benchmark, jumped from around 37 to above 44, marking its largest spike since November.
That kind of move shows a combination of realized volatility catching up to positioning and a sudden increase in demand for downside protection.

But higher IV isn’t just a sentiment indicator, because it actually changes market behavior: hedging becomes more expensive, short-vol carry becomes less attractive, and liquidity providers tend to widen because the probability of adverse selection rises.
In other words, when the market starts paying up for protection, it often becomes easier for spot to gap through levels rather than trade through them smoothly.
The practical way to understand the current state of the market is that several tectonic shifts happened all at once.
ETF flows removed a vital source of incremental spot demand, macro politics pushed traders toward a tighter-liquidity framing, liquidations converted a pullback into mechanical selling, and implied volatility repriced higher, which tends to keep ranges wide until positioning resets.
If ETF flows stop bleeding and implied volatility settles, we’ll see a more orderly process of price discovery.
If outflows remain heavy while DVOL stays elevated, the market is likely to remain jumpy, because any bounce will be competing with both reduced marginal demand and a volatility regime that encourages caution.
The post Bitcoin reversal on the cards after $1.7 billion liquidation wave flushed out overleveraged traders appeared first on CryptoSlate.


