
Bitcoin bears have been in control lately, with the asset trading well below last year’s peak levels.
The question now is whether BTC can stage a decisive comeback or if a new painful pullback is on the way.
The Bullish Scenario
The primary cryptocurrency started the month on the wrong foot, with the correction intensifying on February 6 when it plummeted to around $60K, the lowest point since October 2024. In the following days, it reclaimed some lost ground and currently trades at approximately $68,200 (per CoinGecko’s data).
One person touching upon the most recent price dynamics of BTC is the popular analyst Ali Martinez. He assumed that the asset appears to have formed an “Adam & Eve” pattern, in which a break above $71,500 could trigger an additional pump to $79,000.
The bullish setup consists of two bottoms: a sharp drop (Adam) followed by a rounder one (Eve). Some traders see it as a sign that selling pressure is fading and that the price may post a substantial short-term revival.
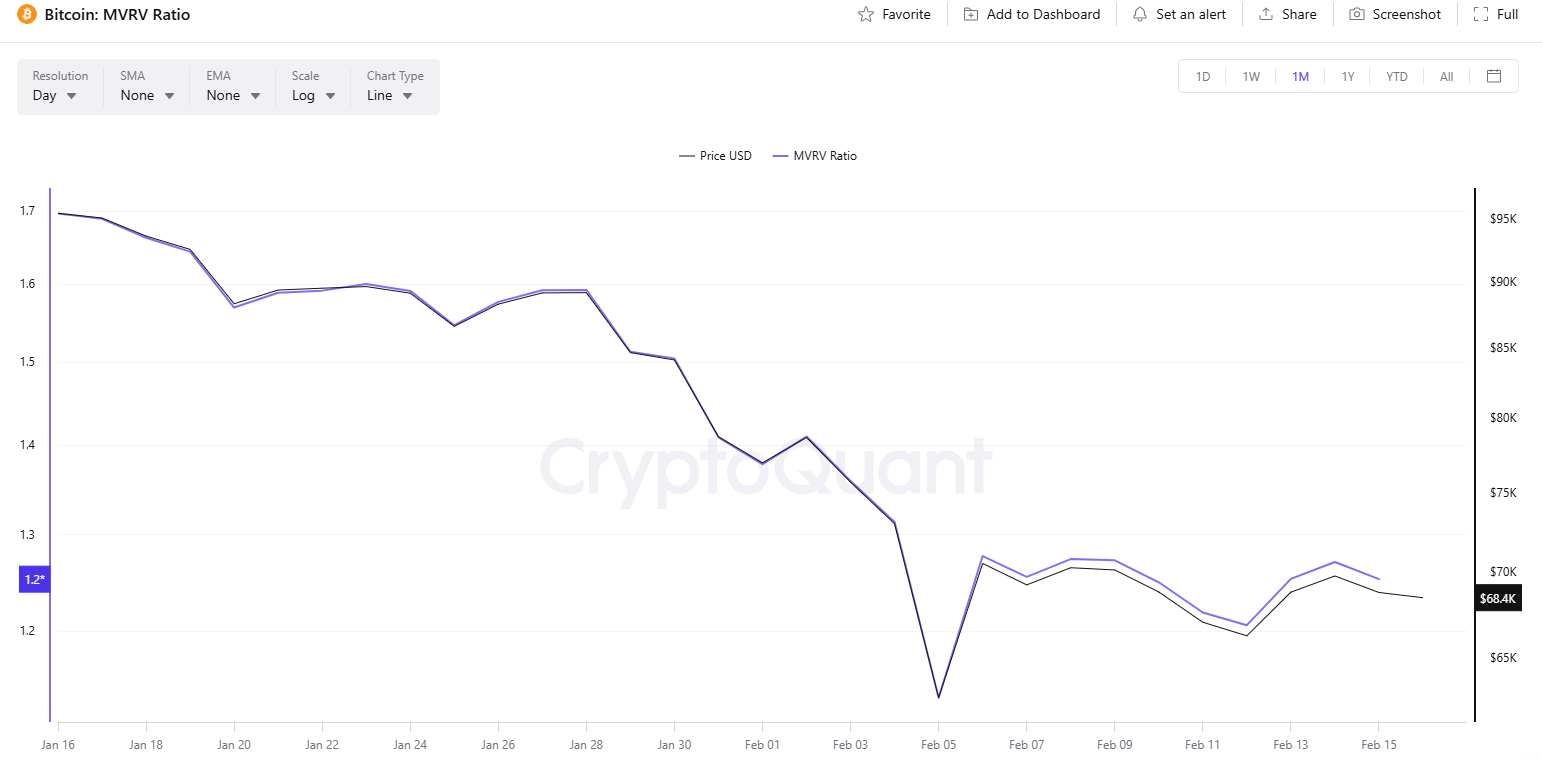
Bitcoin’s Market Value to Realized Value (MVRV) supports the bullish outlook. The index compares the current value of all BTC to the price people initially paid to acquire their holdings. High ratios mean that investors are sitting on big profits and could increase selling pressure, whereas low readings might be interpreted as the end of the bear market.
Over the past few weeks, the MVRV has been steadily declining and now sits near 1.25. According to CryptoQuant, ratios above 3.7 indicate a price top, while values under 1 hint that the bottom could have been reached.
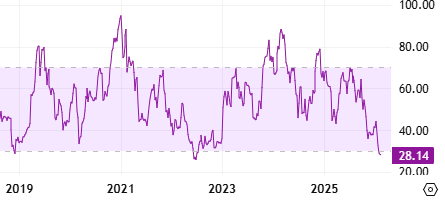
Bitcoin’s Relative Strength Index (RSI) is also worth observing. The technical analysis tool measures the speed and magnitude of recent price changes and provides traders with indications of potential reversal points. It ranges from 0 to 100, with values below 30 seen as buying opportunities and suggesting that BTC may be oversold. On the contrary, ratios above 70 are generally considered a warning of a possible pullback. The RSI has fallen to 28 on a weekly scale.
The Bear Phase Is Just Starting?
Other analysts, including Chiefy, believe another painful decline is the more likely option for BTC in the short term. The X user argued that the asset might be on the verge of a major dump to $29,000 as early as this week and added:
“The final Bull Trap of 2026 is over, and according to this chart, the next crash has already started. Are you actually prepared for the longest bear market in history?”
Meanwhile, BTC balances on centralized exchanges have been climbing in recent weeks. Although this development doesn’t guarantee further downside, it could be interpreted as a bearish sign because it means the number of coins that can be offloaded at any time is increasing.

The post Top Bitcoin (BTC) Price Predictions: Revival to $80K or Brutal Crash Below $30K? appeared first on CryptoPotato.


