

Markets are attempting to stabilize after last week’s volatility, with Bitcoin price now recovering while broader risk sentiment remains fragile and driven by headlines.
Daily chart (D1): neutral bias with a fragile recovery
The daily timeframe sets the core view, and right now it points to a neutral regime, leaning slightly constructive as long as the mid-$60Ks hold.
Trend structure – EMAs
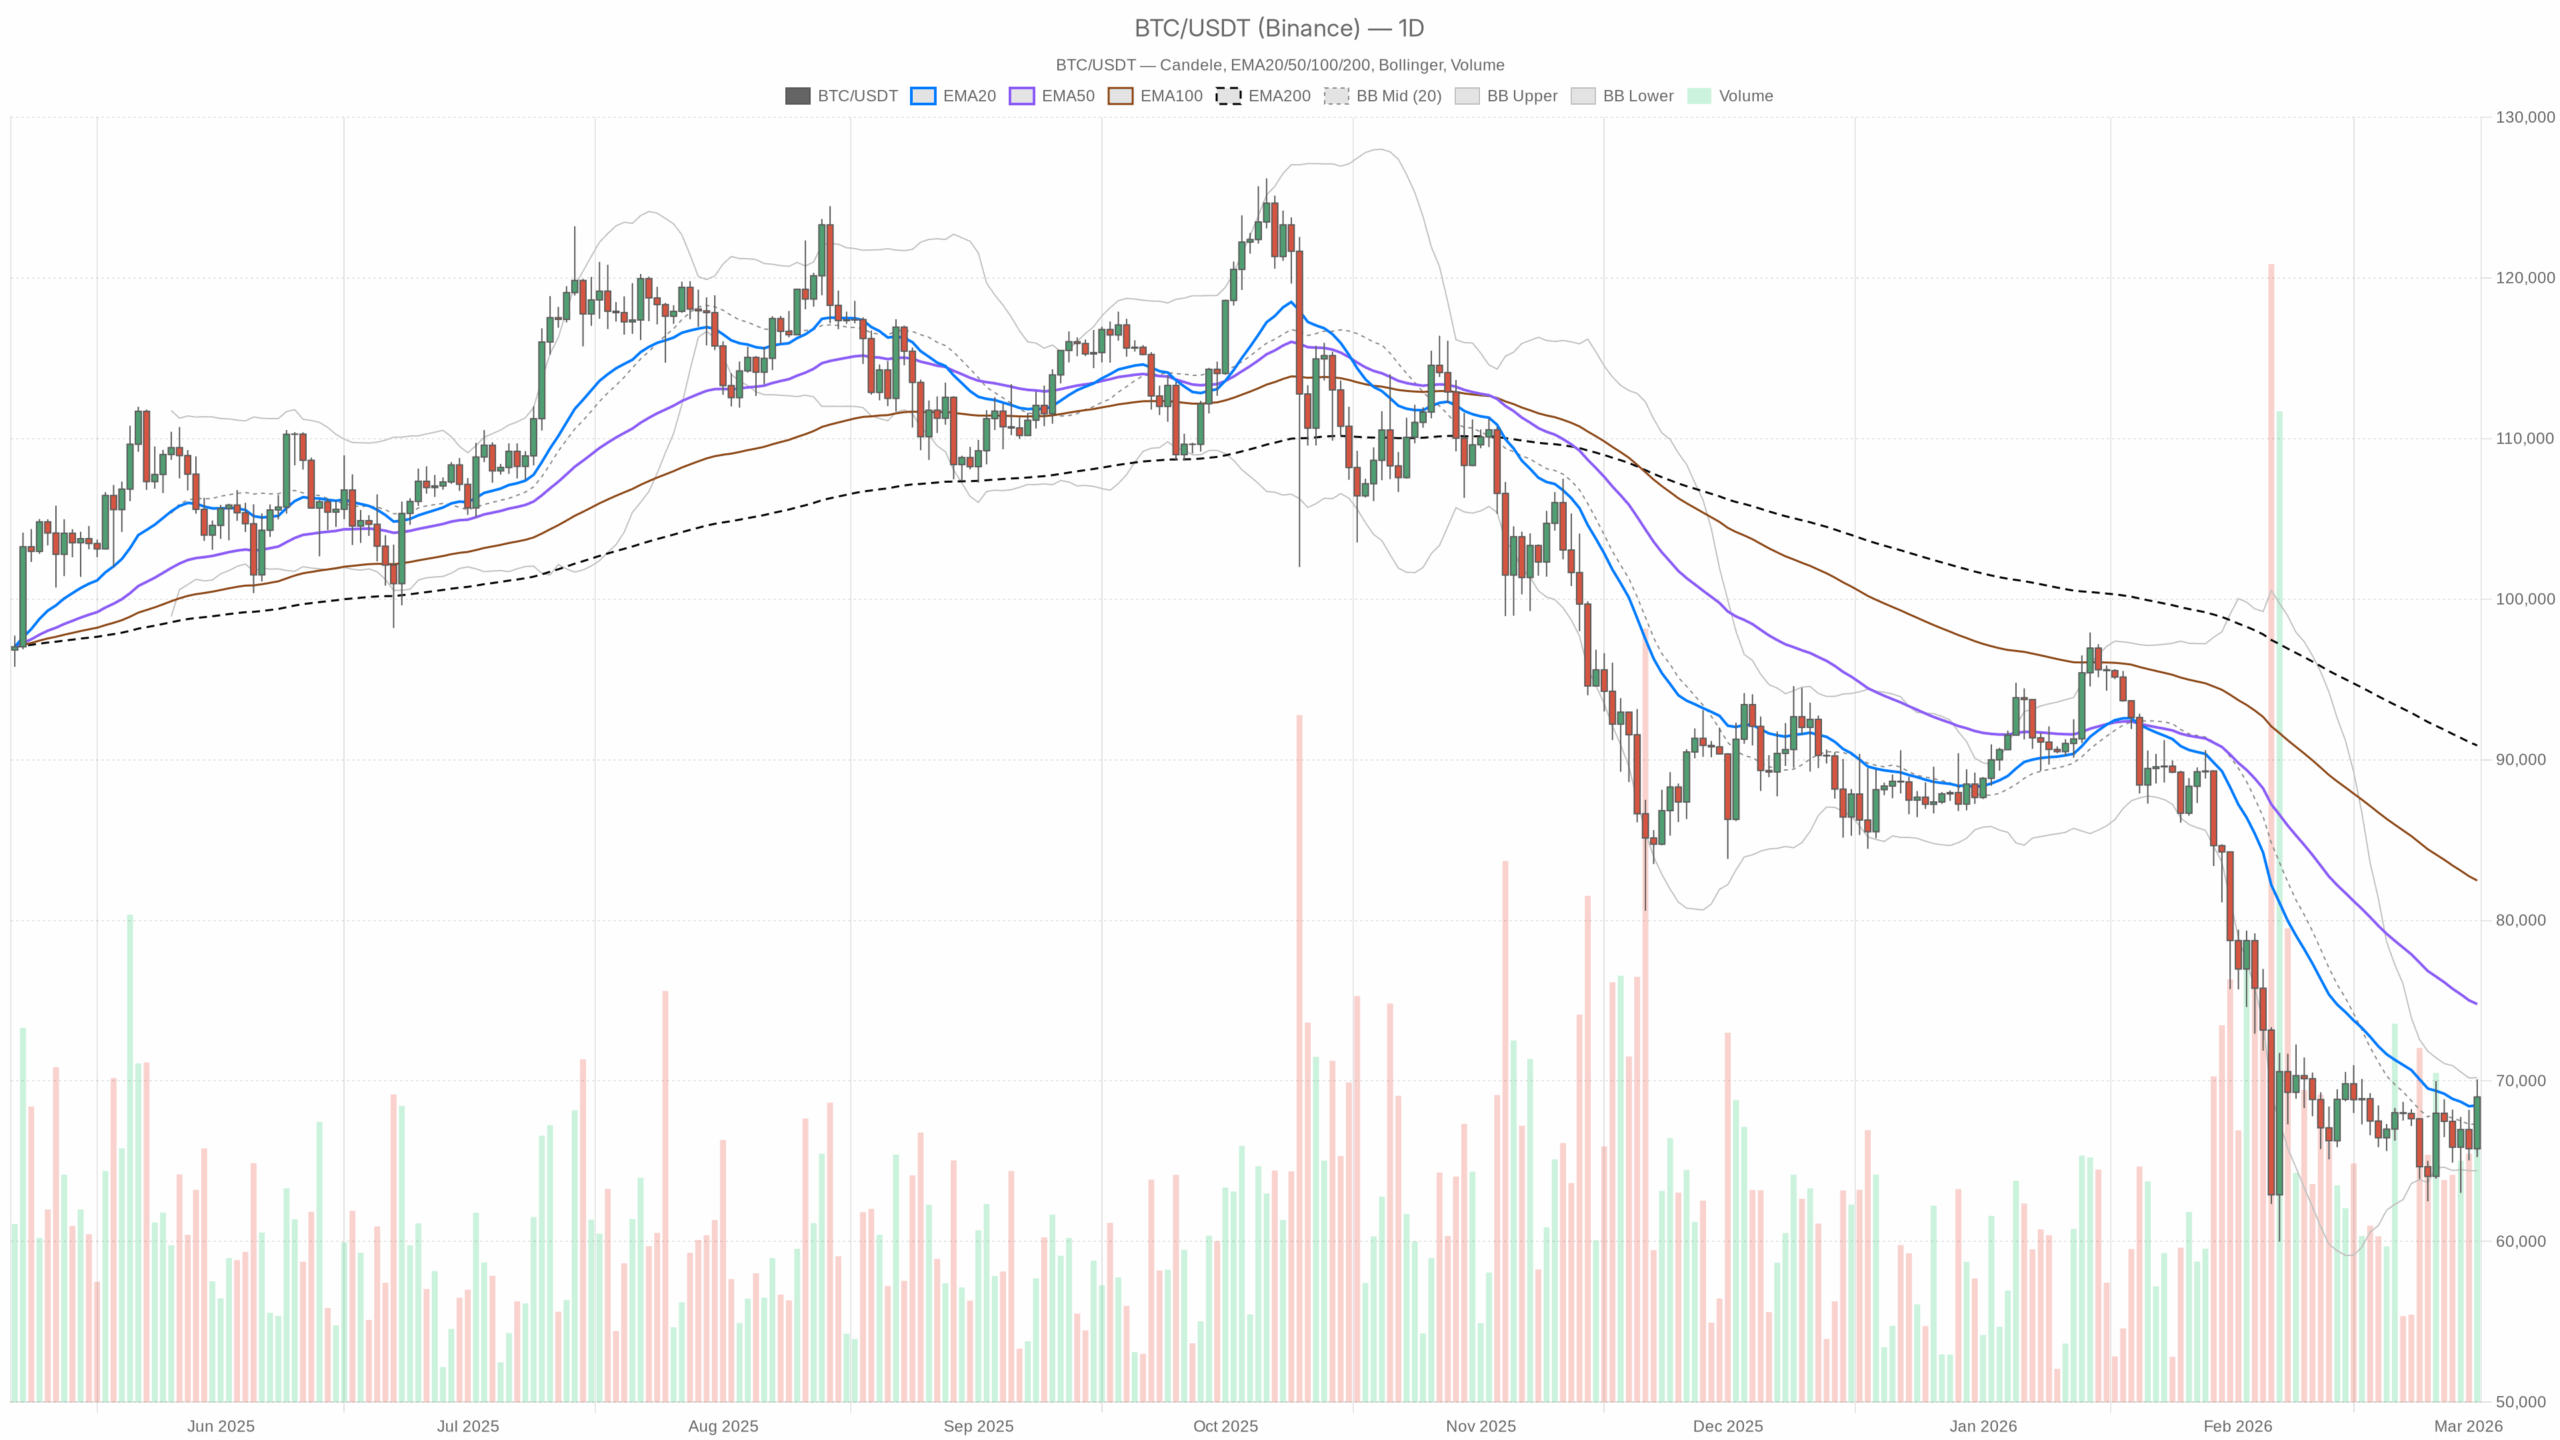
- Price (close): $69,002
- EMA 20: $68,478
- EMA 50: $74,784
- EMA 200: $90,887
Bitcoin price now vs USDT is trading around $69,000, staging a recovery after last week’s flush below $64,000 on the back of U.S.–Israel strikes on Iran and renewed inflation worries. The broader crypto market is up roughly 3% over 24 hours, but sentiment is still gripped by Extreme Fear (index at 10). Bitcoin has reclaimed the 20-day EMA and is sitting just above it, but it is still well below the 50-day and 200-day averages.
In plain terms, short-term momentum has snapped back, yet the broader uptrend that pushed price to prior highs has cooled off. The 20-day now acts as first support around $68.5K, while the 50-day near $75K is the next serious ceiling. Until BTC can flip that 50-day back into support, this remains a market in repair, not in full trend.
Momentum – RSI
- RSI 14 (daily): 47.7
Daily RSI is sitting just under the 50 line, which is classic neutral to slightly undershoot. The market has unwound a lot of froth but has not yet shifted into aggressive accumulation. It suggests dip-buyers are active, but they are not chasing; strength is being sold into, weakness is being bought, and neither side has full control.
Trend-follow vs mean reversion – MACD
- MACD line: -2,466
- Signal line: -3,263
- Histogram: +796
The MACD is still below zero, reflecting the damage from the recent downleg, but the line has crossed above its signal and the histogram is positive. That is an early bullish inflection inside a still-corrective environment. In practice, sellers who dominated in February have lost momentum, yet buyers have not turned this into a sustained trend. It is a bounce with potential, not a confirmed new leg higher.
Volatility and ranges – Bollinger Bands
- Middle band (20-day basis): $67,309
- Upper band: $70,209
- Lower band: $64,408
Price is now trading between the mid and upper bands, hugging the upper half of the band structure but not breaking out. After the spike down toward the lower band on the Iran headlines, this looks like a classic mean-reversion bounce. As long as BTC stays above the mid band, near $67.3K, the market is more likely to consolidate or grind higher than to revisit panic lows.
A daily close above the upper band would be the first sign that this is turning from a bounce into a momentum move. Conversely, a decisive break back below the middle band on expanding volume would indicate that the recovery is losing steam.
Volatility and risk – ATR
- ATR 14 (daily): $2,995
Daily ATR near $3K means a typical one-day swing is about 4–5% of price. That is elevated but not extreme for Bitcoin. Volatility is high enough that levels can be tested quickly, but the market is not in capitulation mode. Traders should expect intraday whipsaws, especially around geopolitical headlines, yet the tape is not out of control.
Key daily levels – Pivots
- Pivot point (PP): $68,119
- Resistance 1 (R1): $70,979
- Support 1 (S1): $66,142
BTC is currently trading just above the daily pivot, which defines the high-$60Ks as a balance zone. R1 up near $71K lines up neatly with the upper Bollinger Band, making that area a natural first target for the bulls and a likely zone where short-term profit-taking kicks in.
On the downside, S1 at $66.1K sits above the lower band and marks the line where this bounce starts looking fragile if broken on a closing basis. A daily close below that area would increase the odds of a retest of last week’s lows and could open the door to deeper de-risking.
Daily verdict: The main scenario is neutral. The market is trying to stabilize and recover within a broader corrective phase. The bias tilts bullish as long as BTC stays above $66K–$67K, but without a reclaim of the mid-$70Ks this remains a base-building environment, not a clean uptrend.
1-hour chart (H1): short-term bulls in control
- Price (close): $69,042
- EMA 20: $67,246
- EMA 50: $66,700
- EMA 200: $66,554
- Regime: bullish
On the 1-hour chart, BTC is firmly above the 20, 50, and 200 EMAs, with all three sloping higher. That is a short-term uptrend. Dips toward the low-$67Ks are currently being defended aggressively. This is where the tape turns from cautious on the daily to clearly constructive intraday.
H1 momentum – RSI and MACD
- RSI 14 (H1): 66.9
Hourly RSI is in bullish territory, approaching overbought. Buyers are pressing the tape, but price is close to levels where consolidation or mild pullbacks are typical. The structure is strong, but not yet manic.
- MACD line (H1): 646
- Signal line: 292
- Histogram: +354
The hourly MACD is well above zero with a positive spread over the signal line. Short-term trend followers are in charge right now. This confirms the bounce has real momentum behind it, not just a one-candle squeeze.
H1 volatility, bands and intraday levels
- Bollinger mid: $66,911
- Upper band: $69,325
- Lower band: $64,497
- ATR 14 (H1): $865
- Pivot (PP): $68,989
- R1: $69,251
- S1: $68,780
On the hourly, price is pushing right up into the upper Bollinger Band and hovering just above the intraday pivot. That is classic strong-trend behavior: the market is riding the top of the range rather than oscillating around the mean. With ATR at about $865, a typical hourly swing is just over 1%, enough to run stops above or below obvious levels without changing the bigger picture.
Intraday, the $68.8K–$69.3K pocket acts as a key decision zone. A clean rejection could start a pullback toward the mid-band around $67K, while a firm break and hold above $69.3K would keep squeezing shorts into the low-$70Ks.
15-minute chart (M15): execution context, not trend
- Price (close): $69,030
- EMA 20: $68,386
- EMA 50: $67,415
- EMA 200: $66,558
- Regime: bullish
The 15-minute chart is aligned with the hourly: price stacked above the short and long EMAs, with a clear intraday uptrend. This timeframe is mainly useful for pinpointing entries and risk levels inside that hourly structure.
M15 momentum and volatility
- RSI 14 (M15): 62.0
RSI on M15 is comfortably bullish but not stretched. The market has room to extend one more push higher before intraday traders start to seriously de-risk positions.
- MACD line (M15): 784
- Signal line: 773
- Histogram: +11
The 15-minute MACD is positive but the histogram is nearly flat. Momentum is still up, but acceleration has faded. This often precedes either a sideways digestion or a shallow pullback rather than an immediate reversal of trend.
- Bollinger mid: $68,082
- Upper band: $71,334
- Lower band: $64,831
- ATR 14 (M15): $694
- Pivot (PP): $68,985
- R1: $69,243
- S1: $68,773
On the 15-minute, BTC is trading around the pivot and just under R1, with a fairly wide band to the upside thanks to the recent volatility. With a 15-minute ATR of nearly $700, even small intraday decisions can produce sharp wicks. For short-term traders, the $68.7K–$69.3K band is where local battles are being fought. Breaks and reclaims of that zone are likely to set the tone for the next few hours.
Macro backdrop: risk-off headlines, crypto trying to look through
Bitcoin’s move is happening against a backdrop of geopolitical escalation and inflation jitters. Recent U.S.–Israel strikes on Iran have injected headline risk into all risk assets, and prior sessions saw BTC trade as a barometer of that uncertainty, sliding below $64K on initial reports. At the same time, the total crypto market cap has climbed back above $2.43 trillion, up about 3.1% in 24 hours, and Bitcoin dominance sits around 56.6%.
That tells you two things. First, capital is not fleeing the asset class wholesale; it is rotating defensively into BTC over alts. Second, the move is more of a quality rotation inside crypto than a broad risk-on spree. DeFi fee spikes on venues like Uniswap and Curve reflect heightened on-chain activity around the volatility bursts, but the 30-day fee trends point to a market still digesting rather than euphoric.
The fear and greed index at Extreme Fear (10) is a stark contrast to price stabilizing in the high-$60Ks. Historically, such sentiment extremes occurring above long-term averages often coincide with attractive long-horizon entries, but they can stay depressed if macro risk worsens. This disconnect, with scared sentiment and resilient price, is exactly where large players probe liquidity on both sides of the tape.
Scenarios for Bitcoin price now
Bullish scenario
In the bullish version, the current move is the start of a base-to-trend transition. Hourly and 15-minute uptrends continue, pulling the daily structure with them. BTC holds above the daily pivot at $68,100 and, ideally, above the intraday support band at $68K–$68.5K. Buyers use any dips into the 20-day EMA around $68.5K as an opportunity to reload.
From there, price breaks and closes firmly above the $71K area, where R1 and the daily upper band converge, converts that zone into support, and begins grinding toward the $74K–$75K pocket where the 50-day EMA sits. A daily RSI move back above 55–60 and a MACD cross through the zero line would confirm that the bounce has graduated into a renewed uptrend. Under this path, extreme fear becomes fuel for a squeeze as under-exposed players chase back in.
This bullish scenario is invalidated if BTC loses $66K on a daily close and fails to quickly reclaim it. That would put price back under the daily pivot range and close to the lower Bollinger Band, suggesting the bounce was just a reaction to headlines rather than genuine accumulation.
Bearish scenario
In the bearish version, the current strength is a textbook relief rally inside a larger distribution. BTC stalls in the $70K–$71K resistance cluster, with intraday RSI stuck in overbought territory and unable to push higher highs. Sellers then step back in, driving price back through the 1-hour EMAs and under the daily pivot, forcing a retest of $66K–$64.5K, where the lower Bollinger Band and recent panic lows sit.
If that lower band area breaks on expanding daily ATR and a renewed negative MACD histogram, the market shifts decisively from neutral to bearish on the daily timeframe. In that world, geopolitical and macro fears are not priced in but instead act as the catalyst for deeper de-risking, with BTC potentially sliding into the low-$60Ks or below as liquidity thins out.
This bearish scenario is invalidated if BTC reclaims and holds above $75K, the 50-day EMA, with daily RSI pushing back into the 60s. At that point, the argument for a larger distribution top weakens significantly, and the tape goes back to being a trend-following environment with pullbacks bought rather than sold.
Positioning, risk and uncertainty
From a trading perspective, the market is sending mixed but tradeable signals. The daily view is neutral with early recovery signs, while intraday structure is clearly bullish. That usually favors nimble positioning, respecting the upside momentum on lower timeframes but framing it inside a higher-timeframe consolidation where ranges can break either way.
Volatility is elevated, narrative risk is high, and sentiment is one-sidedly fearful even as price stabilizes. That is a good environment for opportunity but a bad one for complacency. Position sizes, leverage and stop placement matter more than usual because headlines around Iran, inflation, or policy can move BTC several thousand dollars in a session, regardless of what the chart looked like an hour before.
In short, Bitcoin price now is in a recovery phase under macro stress. The path from here depends on whether this bounce can reclaim the mid-$70Ks and reset the uptrend, or whether geopolitics and risk-off flows turn the high-$60Ks into just another stop on the way lower. Traders who stay honest about those two paths, and adapt as the levels break or hold, will be better positioned than those who anchor to a single narrative.


