

Bitcoin Price Prediction – May 20
Our Bitcoin price prediction shows that BTC/USD is up by more than 10% as the price struck a sudden and bullish price spike.
BTC/USD Long-term Trend: Bearish (Daily Chart)
Key levels:
Resistance Levels: $50,000, $52,000, $54,000
Support Levels: $28,000, $26,000, $24,000
BTC/USD is currently pushing the price towards the 9-day moving average. The coin is moving above $40,000 to trade at $40,574 at the time of writing. More so, the first digital asset is moving with strong bullish momentum after a sustainable break below the channel. The Bitcoin price has gained over 10.46% since the European session.
Bitcoin Price Prediction: Can Bitcoin Price Go Up or Down?
The return above $40,000 could set the framework for gains towards $45,000. Meanwhile, the technical analysis shows that the bulls are ready for action especially when the up-trending Relative Strength Index (14) is considered. Any further bullish movement above the 9-day moving average could pave the way for the gains toward the resistance levels of $45,000, $50,000, and $55,000.
On the downside, if the price falls back below the $35,000 level and moves to cross below the channel, the bears may wrestle out control over the situation very quickly. This may likely serve as a major blow for the market sentiments as traders could interpret it as a sign of underlying weakness. The next important supports may come at $31,000, $27,000, and $22,000.
BTC/USD Medium – Term Trend: Bearish (4H Chart)
The 4-hour chart reveals that the Bitcoin price is currently trading around $40,497 within the 9-day and 21-day moving averages after recovering from $38,172 in the last few hours. However, the 4-hour chart shows that bulls are stepping up slowly in the market while the bears are also trying to bring the price down.
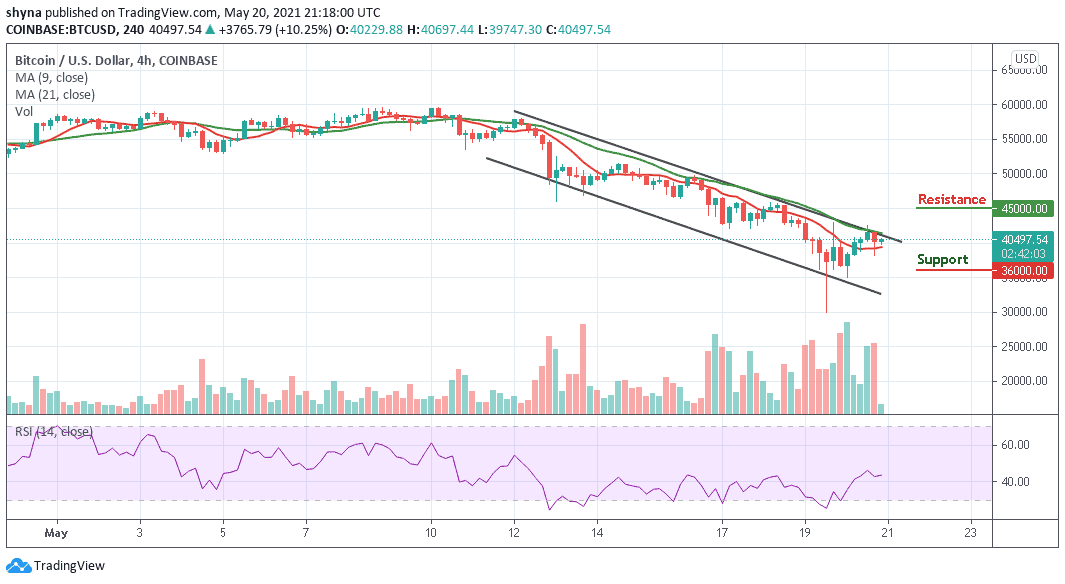
Moreover, if the buyers could energize and push the price above the channel, the Bitcoin price could test the resistance level of $45,000 and above. Meanwhile, the Relative Strength Index (14) is currently moving around 40-level, but when it turns down; the bears could step back into the market and may bring the price to the support level of $36,000 and below.
